
Figure 1.
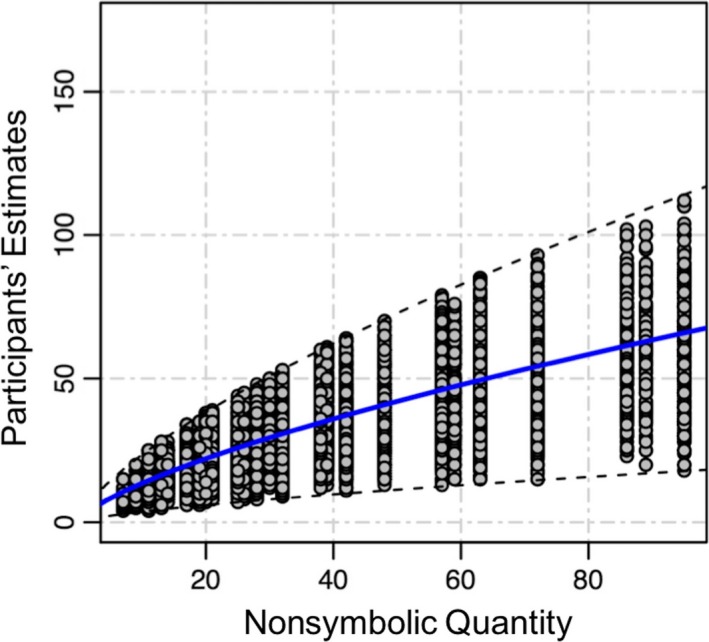
The relation between nonsymbolic numerosities presented in the behavioral estimation task and participants' mean estimates. The blue line represents the mean power fitting function, Y = 2.72 * X 0.70, where Y is the predicted perceived dot quantity and X is the actual presented dot quantity. The dashed lines represent upper boundary and lower boundary of outlier removal