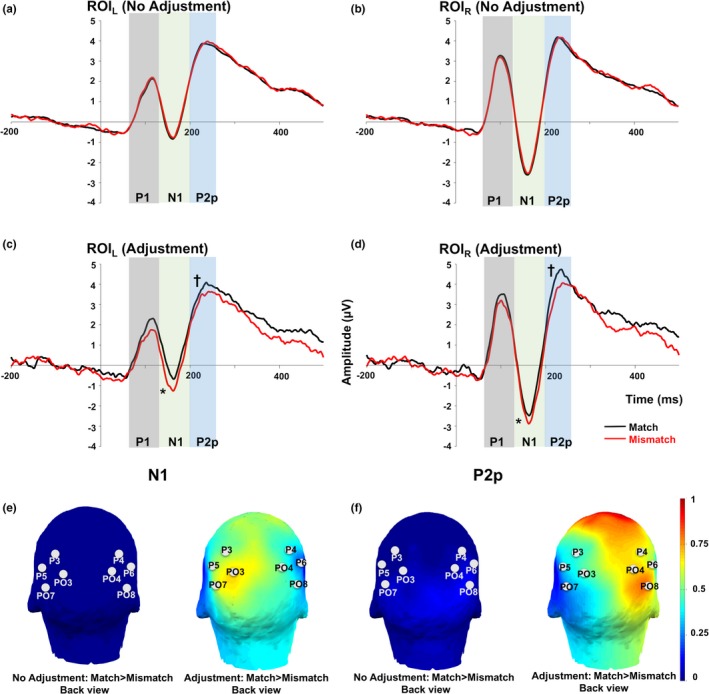
Figure 2.

The ERP waveforms of match (black lines) and mismatch condition (red lines). (a) The waveforms of the left ROI in the no‐adjustment analysis. (b) The waveforms of the right ROI in the no‐adjustment analysis. (c) The waveforms of the left ROI in the adjustment analysis. (d) The waveforms of the right ROI in the adjustment analysis. Gray bars: P1 (70–130 ms). Light green bars: N1 (130–200 ms). Light blue bars: P2p (200–250 ms). (e, f) Topographic map of the mismatch effect for N1 component (e) and P2p component (f). Left: unadjusted data. Right: adjusted data. *p < .05. †p < .1
