
Figure 1. bRNaseA and ANG associate with EGFR and trigger EGFR signaling.
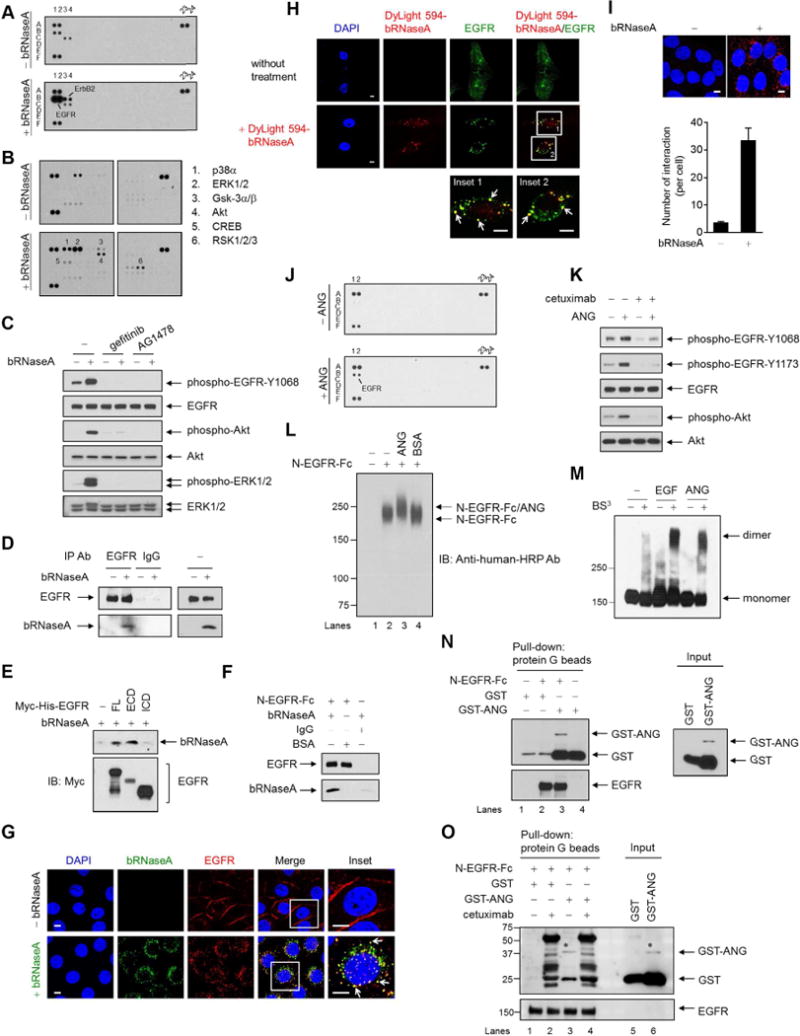
(A) Human phospho-RTK antibody array analysis of HeLa cells serum-starved for 24 hr, followed by bRNaseA (100 μg/ml) treatment for 5 min.
(B) Human phospho-kinase antibody array analysis of HeLa cells treated with or without bRNaseA for 5 min.
(C) HeLa cells pretreated with gefitinib and AG1478 followed by bRNaseA treatment and immunoblot (IB) with the indicated antibodies.
(D) Immunoprecipitation of HeLa cells with antibodies targeting EGFR or normal IgG. Right, input lysates.
(E) In vivo binding assay of bRNaseA in 293T cells transfected with Myc-His-tagged EGFR containing full-length (FL), extracellular domain (ECD), or intracellular domain (ICD) expression plasmid. His beads were used for pull-down.
(F) In vitro binding assay of bRNaseA and N-EGFR-Fc, an N-terminal EGFR recombinant protein. Pull-down was performed using protein G beads. Negative control, normal IgG and BSA.
(G and H) Confocal microscopy of untreated HeLa cells and those treated with bRNaseA (G) or DyLight 594-bRNaseA (H) for 15 min stained with DAPI and the indicated antibodies. Insets, 6.5× magnification. Bar, 5 μm.
(I) HeLa cells stained with EGFR and bRNaseA antibodies and subjected to Duolink in situ PLA. Bar, 5 μm. Bar diagrams, the number of interactions per cell. Error bars represent mean ± SD.
(J) Human phospho-RTK antibody array analysis of HeLa cells serum-starved for 6 hr followed by ANG (1 μg/ml) treatment for 4 min.
(K) HeLa cells pretreated with cetuximab followed by ANG treatment for 5 min and then subjected to IB with the indicated antibodies.
(L) In vitro binding assay of N-EGFR-Fc with ANG cross-linked with DSP and followed by IB under a non-reducing and non-denaturing condition. BSA, negative control.
(M) Dimerization assay of HeLa cells cross-linked with BS3 and followed by IB under a non-reducing and non-denaturing condition. EGFR antibody was used to detect EGFR monomers and dimers.
(N) In vitro binding assay of N-EGFR-Fc incubated with GST-tagged plasmid expressing ANG (GST-ANG) or empty vector (GST). Protein G beads were used for pull-down. Right, input lysates. The 26-kDa GST band is a product of GST-ANG degradation.
(O) In vitro binding assay of N-EGFR-Fc incubated with GST-ANG or GST and cetuximab. *binding and expression of GST-ANG similar to that shown in lane 3 in (N). Non-specific bands in lanes 2 and 4 were mainly from heavy and light chains of cetuximab mAb, which recognizes N-EGFR-Fc. Protein G beads were used for pull-down. These non-specific bands did not appear in (N).
See also Figure S1.