
Figure 2. ANG binds to EGFR via Q93 and acts as a high-affinity EGFR ligand, requiring of EGFR domains I and III.
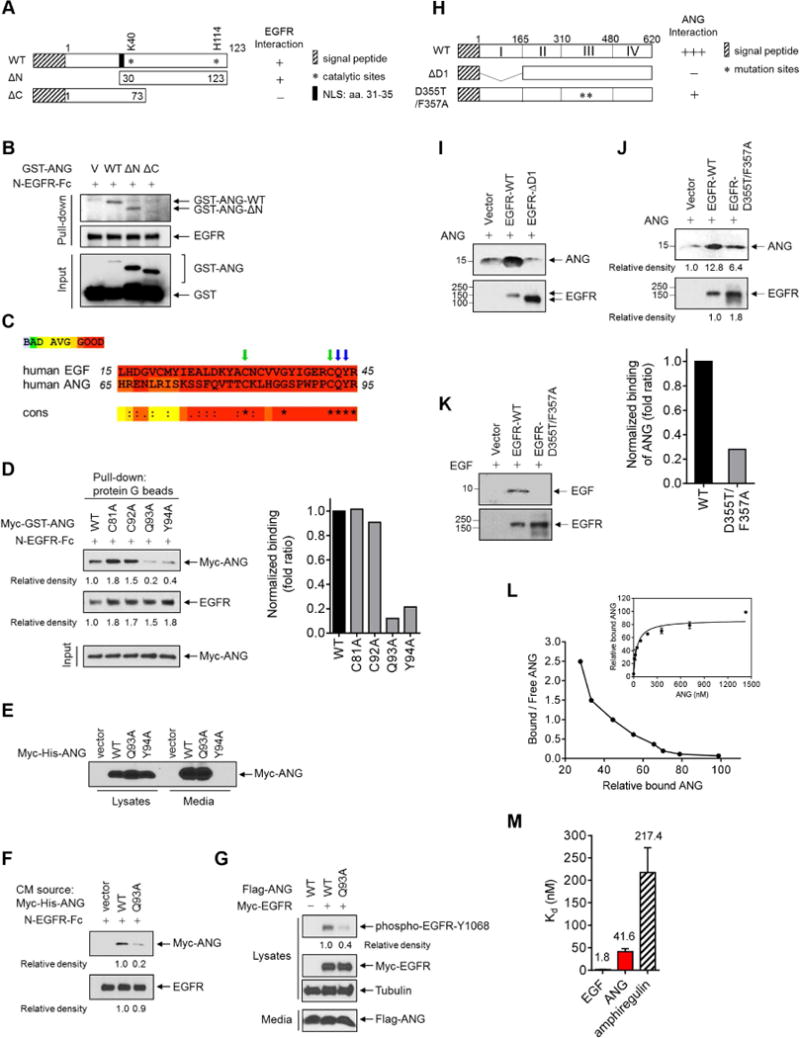
(A) Schematic diagram of wild-type (WT), N-terminal deletion (ΔN), and C-terminal deletion (ΔC) constructs of GST-ANG. The numbers represent amino acid residues. NLS, nuclear localization sequence.
(B) In vitro binding assay of N-EGFR-Fc incubated with the indicated construct. Protein G beads were used for pull-down.
(C) Sequence alignment of human ANG and human EGF. *indicates 100% identity, and colons and dots partial identity.
(D) Left, in vitro binding assay of N-EGFR-Fc with Myc-tagged ANG containing the indicated construct. Protein G beads were used for pull-down. Relative density of Myc-GST was quantified using the ImageJ software program (version 1.38×; NIH), and signals representing ANG-WT were set as 1. Right, normalized fold ratio of ANG bound to EGFR.
(E) IB of 293T cells expressing WT, Q93A, or Y94A Myc-His-ANG, or empty vector in the lysates and in the media.
(F) Binding assay of N-EGFR-Fc with the collected media from 293T cells transfected with the indicated construct. Protein G beads were used for pull-down.
(G) IB of cell lysates and secreted proteins (media) in NIH-3T3 stable transfectants expressing the indicated ANG and EGFR plasmids.
(H) Schematic diagram of wild-type (WT), domain I deletion (ΔD1), and domain III mutation (D355T/F357A) constructs of EGFR (His-EGFR-ECD). The numbers represent amino acid residues.
(I–K) In vivo binding assay of ANG (I and J) or EGF (K) incubated with the indicated EGFR constructs. His beads were used for pull-down. (J) Top, signals quantified using ImageJ. Signals representing ANG-WT were set as 1. Bottom, normalized fold ratio of ANG bound to EGFR.
(L) Scatchard plot of ANG binding to EGFR. Data transformed from Kd values determined by saturation binding assay in A431 cell lysates (right inset).
(M) Bar diagram comparing Kd values derived from ANG, EGF, and amphiregulin binding to EGFR. Each experiment was performed twice in triplicate. All error bars represent mean ± SD.
See also Figure S2.