
Figure 7. Knockdown of ANG decreases sensitivity to erlotinib treatment in pancreatic cancer cells.
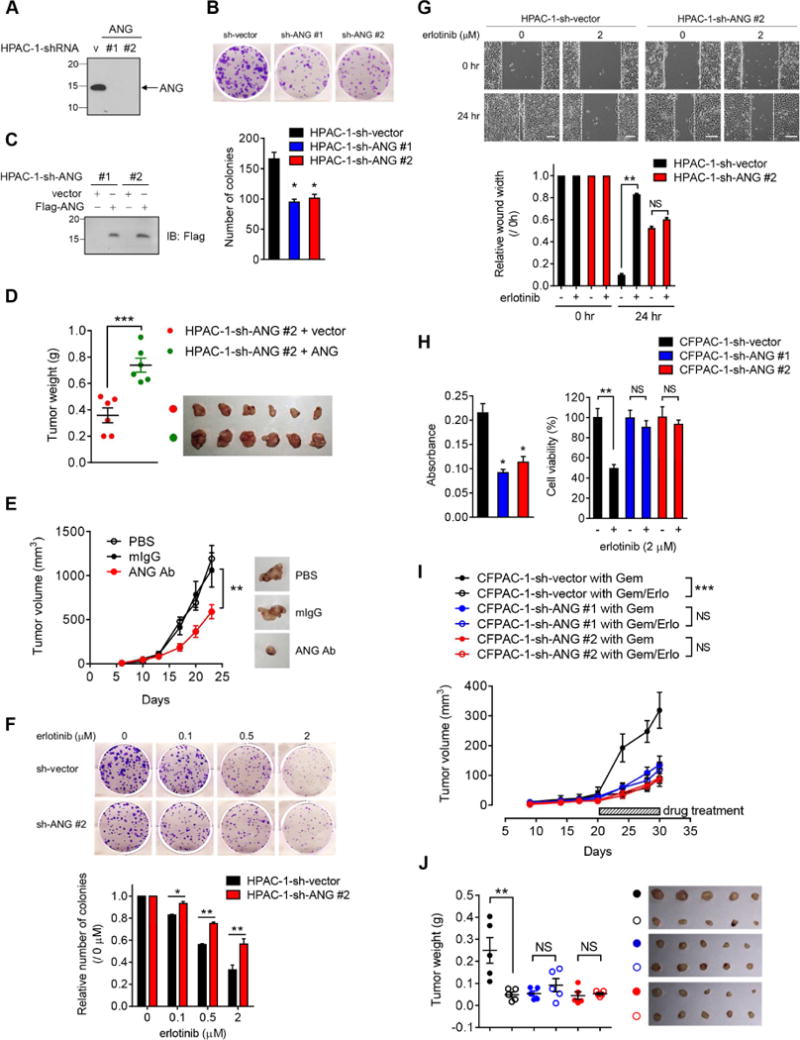
(A) IB of secreted proteins in HPAC-1 stable transfectants with ANG knockdown (HPAC-1-sh-ANG #1 and HPAC-1-sh-ANG #2) and empty vector (HPAC-1-sh-vector).
(B) Top, representative images of colony formation capability of HPAC-1 stable transfectants in 6-well plates at day 10. Bottom, quantification of colony formation capability. Each experiment was performed three times in duplicate.
(C) IB of the reconstitution of ANG (Flag-ANG) to restore expression in two independent HPAC-1-sh-ANG stable clones.
(D) Tumor weight analysis of the indicated groups in (C). n = 6 mice per group. Lines represent mean ± SD.
(E) Tumor growth of mice subcutaneously injected with HPAC-1 cells followed by treatment with PBS, mouse IgG (mIgG), or ANG Ab. Representative images shown. n = 6 mice per group.
(F) Top, representative images of colony formation capability of HPAC-1 stable transfectants treated with increasing concentrations of erlotinib in 6-well plates at day 10. Bottom, quantification of colony formation capability. Each experiment was performed three times in duplicate. The number of colonies at the indicated erlotinib concentration was normalized against that without erlotinib treatment (0 μM).
(G) Top, representative images of wound healing assay of HPAC-1 stable ransfectants treated with or without erlotinib for 24 hr. Bar, 500 μm. The distance of the wound gaps was determined using ImageJ. Wound width normalized against that at time 0 is shown in the plot.
(H) Cell viability of CFPAC-1 stable transfectants measured by MTT assay. Left, absorbance was measured at 595 nm with a reference wavelength of 650 nm. Quantification of MTT viability assay of CFPAC-1 stable transfectants treated with or without erlotinib (2 μM) for 72 hr. The percentage of cell viability in CFPAC-1 stable transfectant with erlotinib treatment was normalized against that without erlotinib treatment.
(I) Tumor growth of mice subcutaneously injected with the indicated CFPAC-1 cells followed by treatment with gemcitabine plus either erlotinib (Gem/Erlo) or a matched vehicle (Gem). n = 5 mice per group.
(J) Tumor weight analysis of the indicated groups in (I). n = 5 mice per group. Lines represent mean ± SD.
All error bars represent mean ± SD. *p < 0.05, **p < 0.01, ***p < 0.001, NS, not significant, Student’s t-test. Tumor growth was evaluated by ANOVA analysis, **p < 0.01, ***p < 0.001, NS, not significant.
See also Figure S7.