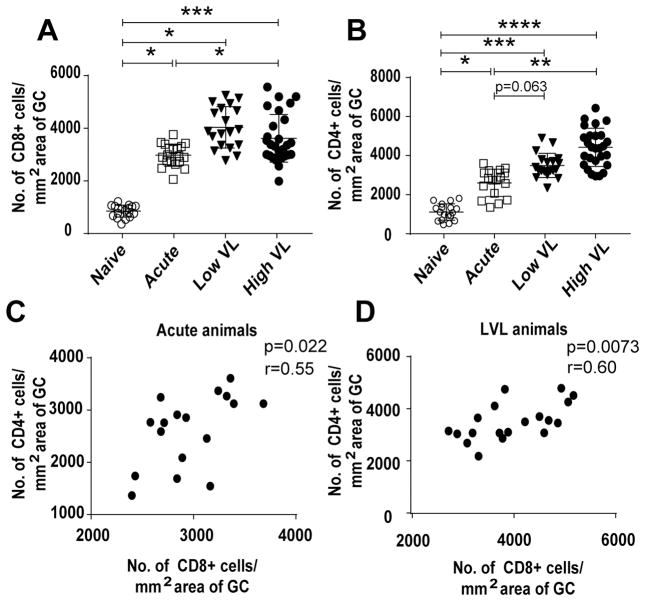
Figure 3.
Quantitation of CD4+ and CD8+ cells in GCs of rhesus macaques. (A) Frequency of CD8+ cells in GCs of naïve and acutely and chronically SIV infected macaques. (B) CD4+ cell frequency in GCs of all groups of macaques. (C–D) Correlation between the number of CD8+ and CD4+ cells in acutely infected and LVL animals, respectively. Data analyzed by repeated measures ANOVA (A, B) and the Spearman correlation test (C–D). In (A) and (B), p values for multiple pairwise comparisons of the groups were corrected using Tukey’s method. Horizontal and vertical bars denote mean and standard deviation. * P < 0.05; * * P < 0.01; * * * P < 0.001, * * * * P < 0.0001.

