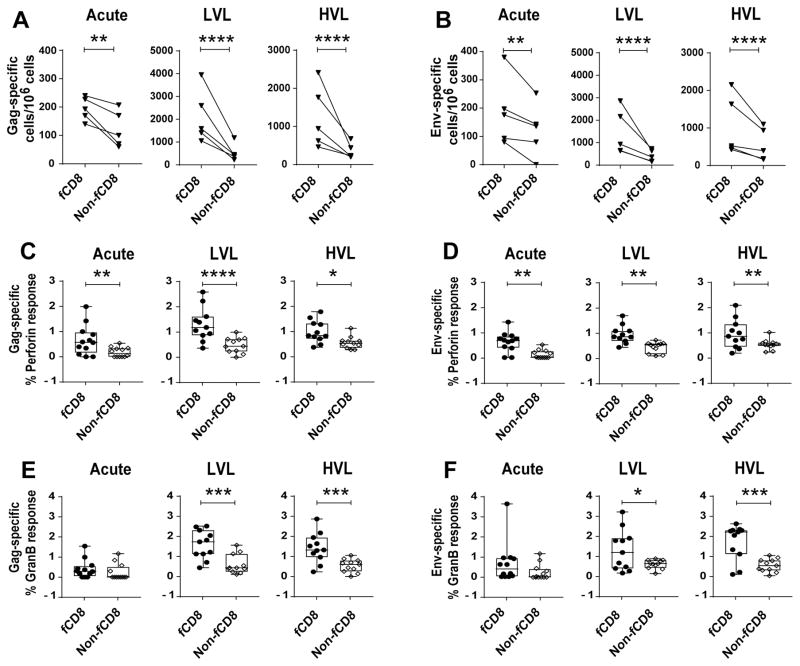
Figure 7.
Comparison of SIV-specific frequency and cytokine producing cells in fCD8 and non-fCD8 cells. (A–B) Frequency of SIV-Gag and Env-specific fCD8 and non-fCD8 cells in LN of SIV-infected macaques. (C–F) Percentage of SIV-specific perforin+ (C, D) and Granzyme B+ (E, F) fCD8 and non-fCD8 cells in response to Gag (C, E) or Env (D, F) peptide stimulation. The data of (A–F) were analyzed with ANOVA. Horizontal and vertical bars denote mean and standard deviation. * P < 0.05; * * P < 0.01; * * * P < 0.001, * * * * P < 0.0001.

