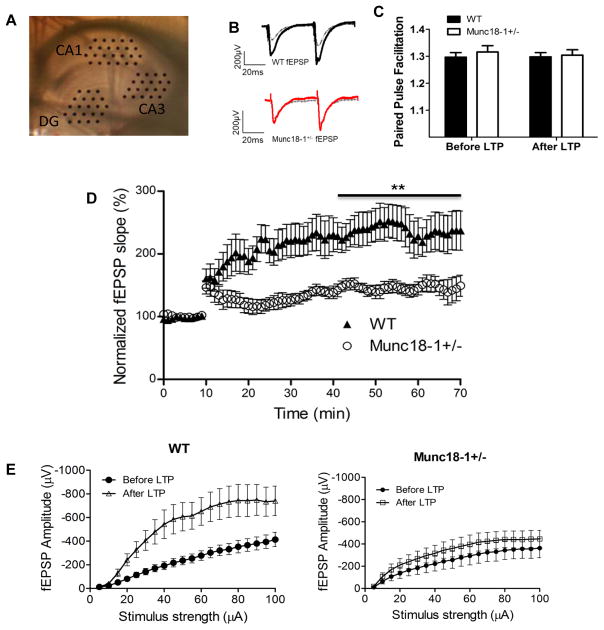
Fig. 3.
Reduced synaptic potentiation of hippocampal CA1 synapses in munc18+/− mice. (A) Picture of hippocampal slice in MED 64 probe with electrodes positioned on the dentate gyrus (DG), CA3 and CA1 regions. (B) Representative traces for munc18-1+/− and WT before (dashed grey) and after (black for WT and red for munc18-1+/−) LTP induction. (C) Ratio of amplitudes in paired pulse facilitation at 50 ms for both WT and munc18-1+/− animals either before or 60 minutes after LTP. (D) Normalized fEPSP for both munc18-1+/− (n=5 animals; 7 slices) and WT (n=8 animals; 10 slices) depicting munc18-1+/− have impaired LTP ability (p<0.001; students t-test). (E) Input-output curves from CA1 region before (black) and after (red for munc18-1+/− and blue for WT mice) LTP induction. Note that WT had a significantly higher response after LTP induction. Munc18-1+/− show only minor increase in the response after LTP induction.

