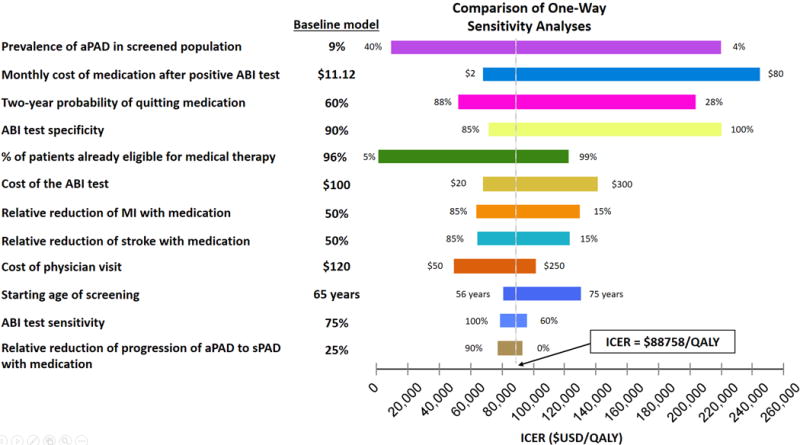
Figure 3.

One-way sensitivity analysis for input variables with uncertainties. The variables are arranged from top to bottom starting with the largest range of ICER depending on the uncertainty range. The baseline value for each variable is noted by the vertical line indicating the ICER of $88,758/QALY. aPAD – asymptomatic PAD, sPAD – symptomatic PAD, MI – myocardial infarction.
