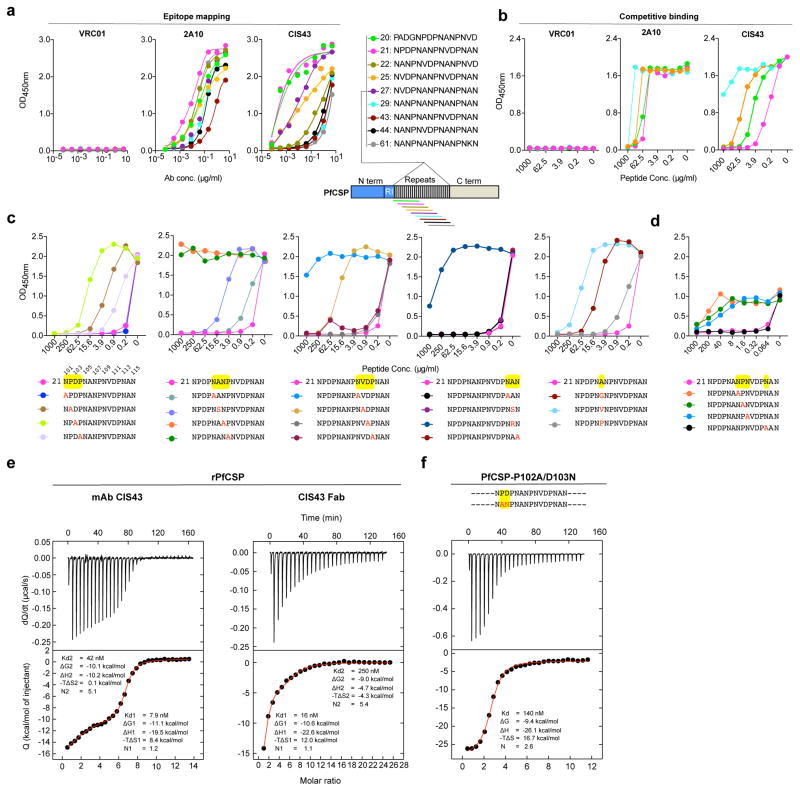
Figure 3. Epitope mapping and ITC analysis of mAb CIS43.
a, Binding of mAb CIS43 to overlapping peptides of PfCSP, with specified sequences numbered and color coded 20 – 61 (representing amino acid residues 97–276) by ELISA. Peptides 28–41 and 46–60, consist only of NANP repeats, and are represented by peptide 29. b, Binding of mAb CIS43 to rPfCSP in the presence of varying concentrations of peptides. Peptide color code as in a. c, Binding of mAb CIS43 to rPfCSP in the presence of peptide 21 sequence variants. Wild type peptide 21 sequence with numeric position listed above and mutated residues highlighted in yellow. d, Binding of mAb CIS43 to PfSPZ in the presence of peptide 21 and its sequence variants. e, ITC of mAb CIS43 and CIS43 Fab binding to rPfCSP. Data are representative of two independent experiments (a–e). f, ITC of mAb CIS43 binding to PfCSP mutant, PfCSP(P102A,D103N), with changes in the junctional epitope sequence depicted in red and highlighted in yellow. Upper panels show the output signal, dQ/dt, as a function of time. Lower panels show the integrated heats as a function of the antibody-site/PfCSP molar ratio in the cell. The solid line represents the result from best non-linear leastsquares fit of the data to a binding model that takes into account two sets of sites with different affinities for rPfCSP. Data shown are representative of three independent experiments. Dissociation constant (Kd), changes in Gibbs energy (ΔG) of binding, enthalpy (ΔH) and entropy (−TΔS) and stoichiometry (N) are shown.

