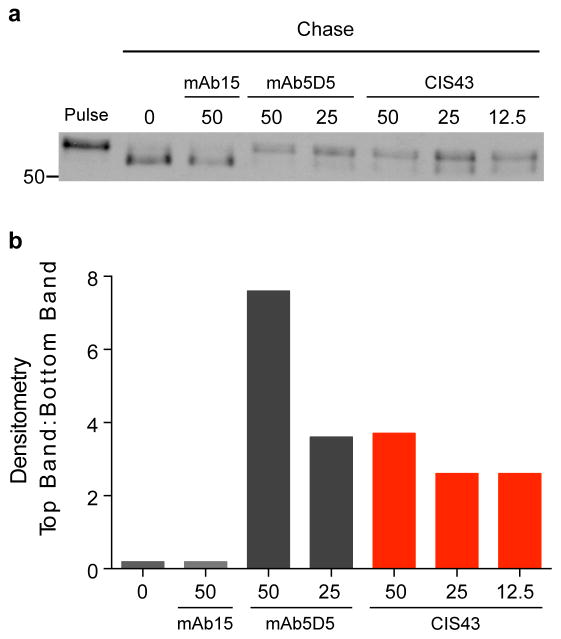
Figure 5. Effect of mAb CIS43 on cleavage of PfCSP.
a, Metabolically-labeled Pf sporozoites were kept on ice (Pulse) or chased for 90 min in the absence, or presence of the indicated mAb concentrations (μg/ml). PfCSP was immunoprecipitated from sporozoite lysates and analyzed by SDS-PAGE and autoradiography. Negative control: mAb15 (anti C-terminus PfCSP mAb, Supplementary Fig. 1c). Positive control: mAb5D5 (mouse anti-N terminus PfCSP mAb). Molecular mass is indicated in kilodaltons on the left side of the autoradiograph. b, Densitometry analysis of scanned autoradiograph shown in a. The density ratio of top to bottom PfCSP bands is shown for each chased sample with mAb concentrations shown below in (μg/ml). A ratio of 1 indicates the density of the top and bottom bands is equal. Data are representative of 3 independent experiments (a–b).

