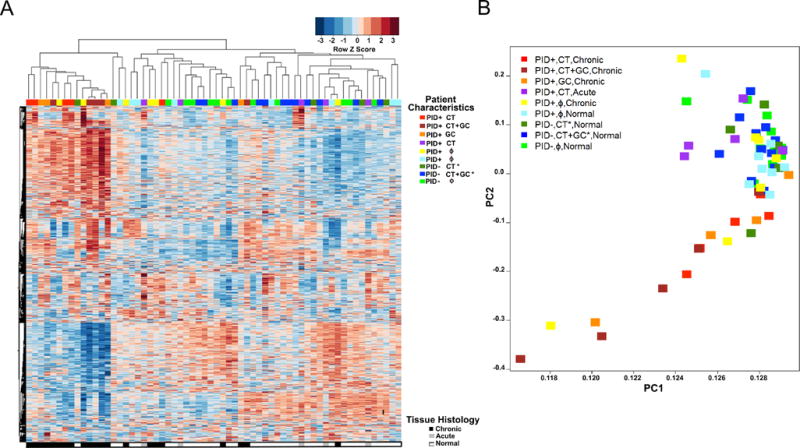
Fig. 1. Women with GC and/or CT PID and chronic endometritis exhibit a distinct whole-blood transcriptional signature.

(A) Unsupervised hierarchical clustering reveals expression patterns of 4952 genes in women with GC and/or CT PID and chronic endometritis as well as six other clinical groups indicated in the graph key and represented in the colored bars at the top of the heat map. Heat map rows indicate genes; columns, individual participants. Clinical groups were determined by symptoms, infection status and endometrial histology. CT*, CT+GC* indicate infection was localized to the cervix. (B) Principal component (PC) analysis of the variance in mRNA expression of the participants depicted in 2A, using the same color scheme with each colored square depicting one subject. The x-axis represents the first principal component, PC1, which accounts for the largest variance of mRNA expression, and the y axis, PC2, explains the second largest variance.
