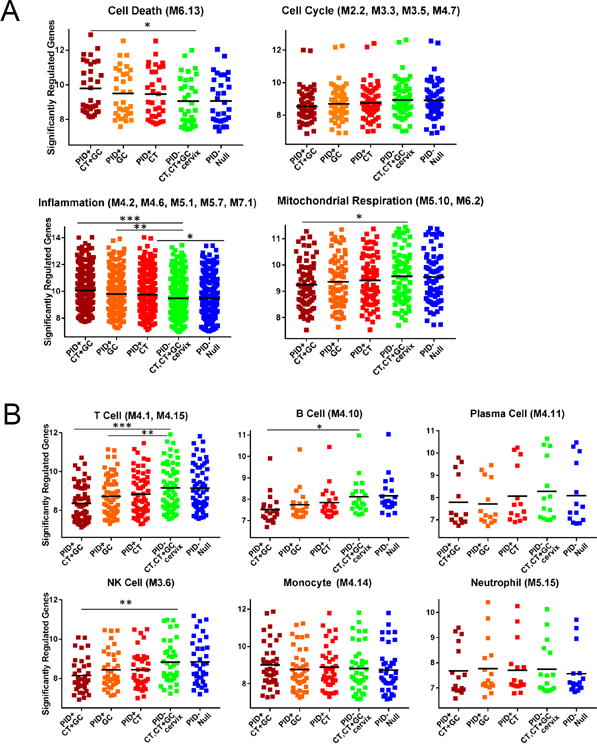
Fig. 7. CT/GC co-infection leads to the most robust enhancement of genes within cell death and inflammation modules, and most significant decrease in lymphocyte and NK cell genes compared to other patient subgroups.

(A). Different median expression of genes within cell death, cell cycle, inflammation and mitochondrial respiration modules among indicated clinical subgroups. (B) Different median expression of genes within T cell, B cell, plasma cell, NK cell, monocyte and neutrophil modules. Dots represent the median expression value for each individual transcript (log2 transformed expression) while the black bar indicates the group mean. (A) and (B) subgroups include women with chronic endometritis and CT/GC co-infection, GC only, CT only, asymptomatic cervical CT+ GC infection, and no infection. ANOVA p< 0.05 after Bonferroni correction for cell death, inflammation, mitochondrial respiration, T cells, B cells, and NK cells modules. Pairwise comparisons after ANOVA were conducted via Student’s t-Test in these 6 modules. *, p < 0.05, ** p < 0.01, *** p < 0.005.
