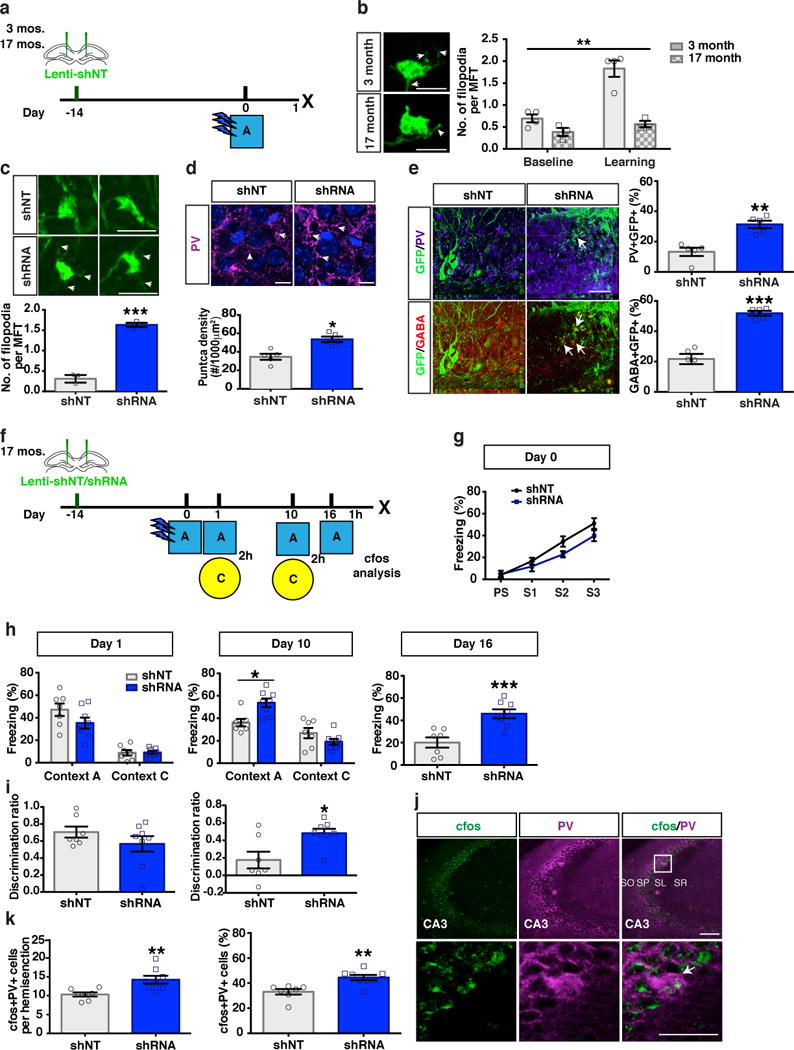
Figure 6. abLIM3 downregulation in DG of aged mice enhances DGC-PV SLIN connectivity and improves remote memory precision.

(a) Schematic of lentiviral shNT/RNA injection into DG of 3-month old and 17-month old mice. (b) Representative images showing GFP+ MFTs with filopodial extensions (arrows) after training (left). Bar graph (right) showing quantification of MFT filopodia number in 3-month old and 17-month old mice at baseline (naïve, unpaired t-test, baseline, 3 month vs 17 month: p=0.06) and after training (Two-Way ANOVA, age X baseline/learning F (1, 10) = 13.03, P = 0.0048, Bonferroni’s post hoc tests: 3 month, baseline vs. learning, p=0.0001. 3 month vs. 17 month following learning, p=0.0001, (4, 3 mice). (c) Representative images (upper) and quantification (lower) showing GFP+ MFT filopodia (arrows) number (75 MFTs from shNT group and 97 MFTs from shRNA group, n=3,3 mice) following lentiviral-shNT/shRNA injection into DG of 17 months old mice. (d) Representative images (upper) and quantification (lower) showing PV puncta (arrows) density in CA3 stratum pyramidale of 17 months old mice (n=5,5 mice). (e) Representative images (left) and quantification (right) showing anterograde labeled PV and GABA+ cells in CA3 by VSV-G injection into DG of 17 months old mice (n=5,5 mice). (f) Schematic of contextual fear conditioning paradigm using aged mice. (g-h) Freezing levels of lenti-shNT/shRNA injected mice during training, test at day 1, day 10 and day 16 (n=7,8 mice). Two-way ANOVA with repeated measures (day 10), context X treatment (shRNA vs. shNT virus), F (1, 13) = 15.58, p=0.0017. (i) Contextual discrimination ratios for day 1 and day 10 (Paired t-test, Day1 vs. Day 10, in shNT mice, p=0.0017) (n=7,8 mice). Two-way ANOVA with repeated measures analysis of discrimination ratios, Virus X Day, F (1, 13) = 10.74, p=0.006. (j) Confocal images show cfos+PV+ cells in CA3 area [including Stratum Pyramidale (SP), Stratum Oriens (SO) Stratum Radiatum (SR) and Stratum Lucidum (SL)]. After context A exposure at day 16. (k) Bar graph with quantification of cfos+PV+ cells counts (left) and percentage of cfos+PV+ cells over total PV+ cells in CA3 area (right) (n=7,8 mice). Scale bar represents 100 μm in j, 50 μm in e and j, 10 μm in d, 5 μm in b and c. Unless otherwise specified, statistical comparisons were performed using two tailed unpaired t-tests. ***p < 0.001, **p < 0.01, *p < 0.05. Data are represented mean ± SEM. See supplementary Table 1
