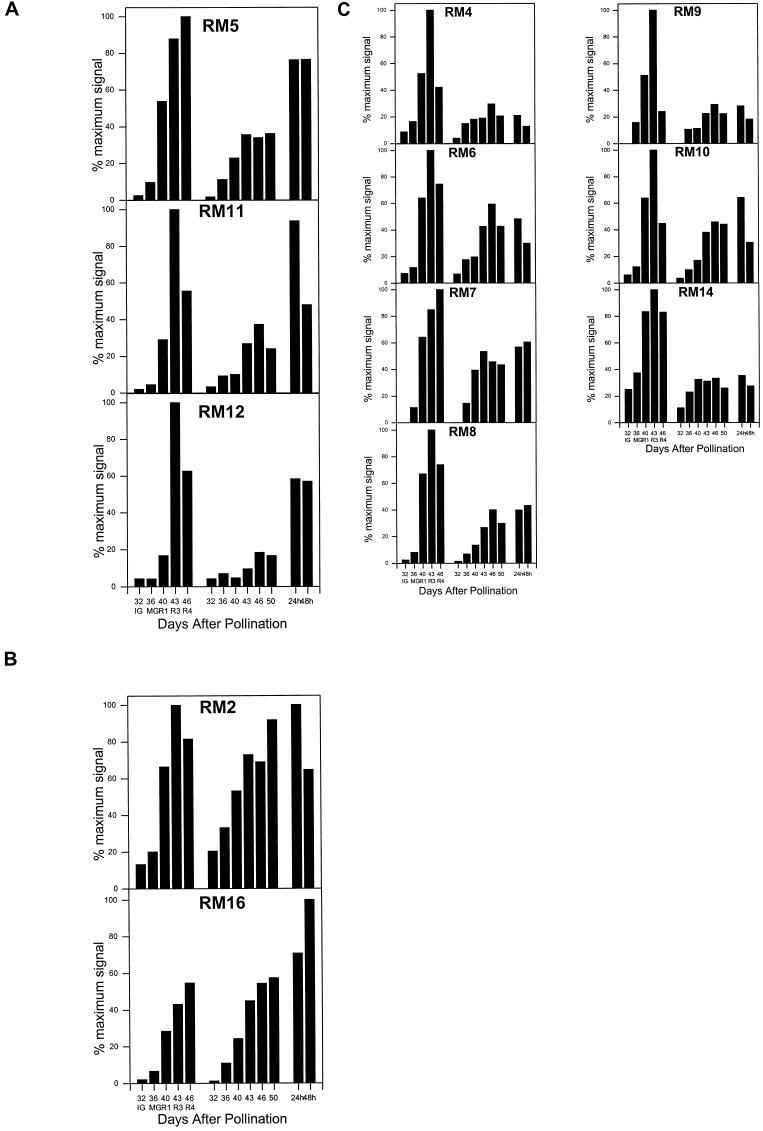
Figure 2.
Phosphor imager data of RNA gel-blot analysis of RM2 to RM7 and RM9 to RM16 RNA in developing wild-type and ACC oxidase antisense melon fruit. Each lane was loaded with 15 μg of total RNA isolated from fruit tissues at five stages of development (see text), from ACC oxidase antisense fruit harvested at 32, 36, 40, 43, 46, and 50 d after pollination, and antisense fruit 50 d after pollination treated with 50 μL L−1 ethylene for 24 h or 96 h. The fruit harvested at these time points corresponded to the IG1, MG, R1, R3, and R4 stages, respectively. The phosphor imager data are expressed for each individual blot in terms of percentage maximum signal detected on that blot. A, Group 1 cDNAs showed a decrease in gene expression in antisense fruit relative to wild type and were induced in antisense fruit treated with ethylene. B, Group 2 cDNA expression was not greatly reduced in antisense fruit relative to wild type, and gene expression was relatively unchanged when antisense fruit were exposed to ethylene. C, Group 3 cDNA expression was reduced in antisense fruit relative to wild type but remained low in antisense fruit exposed to ethylene.

