
Figure 5. Loss of ITPR2 impairs liver regeneration.
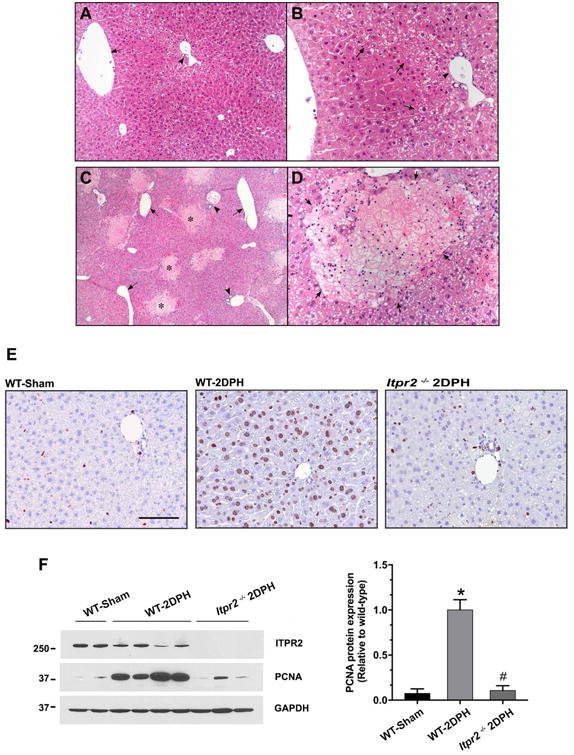
(A-D) Representative photomicrographs of H&E-stained liver sections 2 days after partial hepatectomy (2DPH). (A) Low power view (25×) of wild-type (WT)-2DPH mouse liver. Livers show mild, patchy cytoplasmic clearing that is predominantly periportal in distribution. Minimal small droplet macrovesicular steatosis is seen. There is less steatosis and no necrosis. Symbol: arrow = central vein, arrow-head = portal tract. (B) High power view (200×) of WT-2DPH mouse liver. A region of hepatocytes shows cytoplasmic clearing without swelling, more prominently associated with periportal and zone two regions. Some of the cytoplasmic clearing is due to early steatosis. Symbol: arrow = region of mild cytoplasmic clearing, arrow-head = portal tract. (C) Low power view (25×) of Itpr2-/--2DPH mouse liver. Livers show diffuse, predominantly small droplet, macrovesicular steatosis. Multiple well-circumscribed foci of necrotic hepatocytes (pale staining areas) are scattered randomly throughout the parenchyma, in a non-zonal distribution. Symbol: arrow = central vein, arrow-head = portal tract, * = areas of necrosis. (D) High power view (200×) of Itpr2-/--2DPH mouse liver. Well-circumscribed areas of bland (coagulative type) necrosis are seen (arrows). The necrotic cells show rarefaction of the cytoplasm and loss of nuclei without significant cellular swelling. Rare inflammatory cells, mostly neutrophils, are seen at the periphery and occasionally in the center of the necrotic foci. The viable surrounding liver show small droplet macrovesicular steatosis. No cholestasis is present. (n = 3-6 mice). (E) Representative images of Ki-67 immunohistochemistry staining. Itpr2-/--2DPH mice show less Ki-67-positive cells. Scale bar: 100 μm. (F) Representative immunoblot and relative protein expression of PCNA. Itpr2-/--2DPH mice show less PCNA expression. *p < 0.01, compared with WT-Sham; #p < 0.01, compared with WT-2DPH mice.