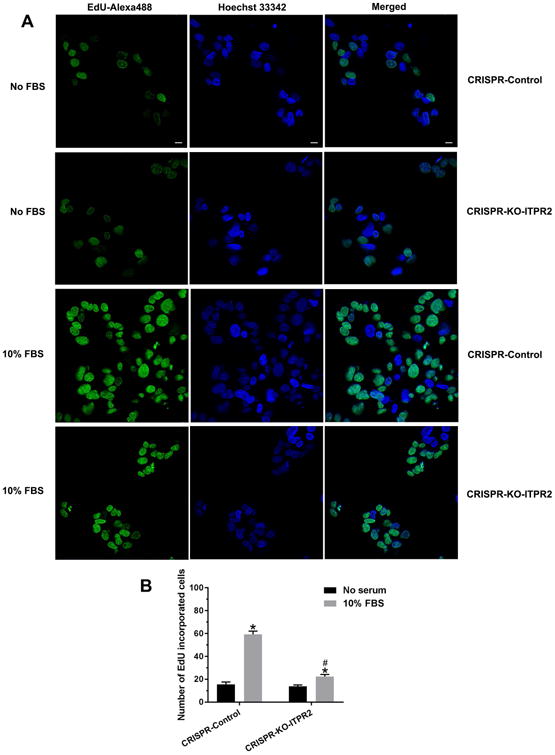
Figure 8. Loss of ITPR2 decreases EdU-incorporation into HepG2 cells.

(A) Confocal imaging of cell 24 hours after addition of serum shows EdU-Alexa Fluor 488 labeling (green), indicative of proliferation, in control and ITPR2-CRISPR-KO cells. Hoechst 33342 labeling identifies all nuclei and merged image identifies proliferating cells. Scale bar: 10 μm. (B) Quantitative analysis of EdU-incorporated cells. *p < 0.05, compared with CRISPR-control without serum; # p < 0.05, compared with CRISPR-control with 10% FBS (6 coverslips in three experiments).
