
Figure 2.
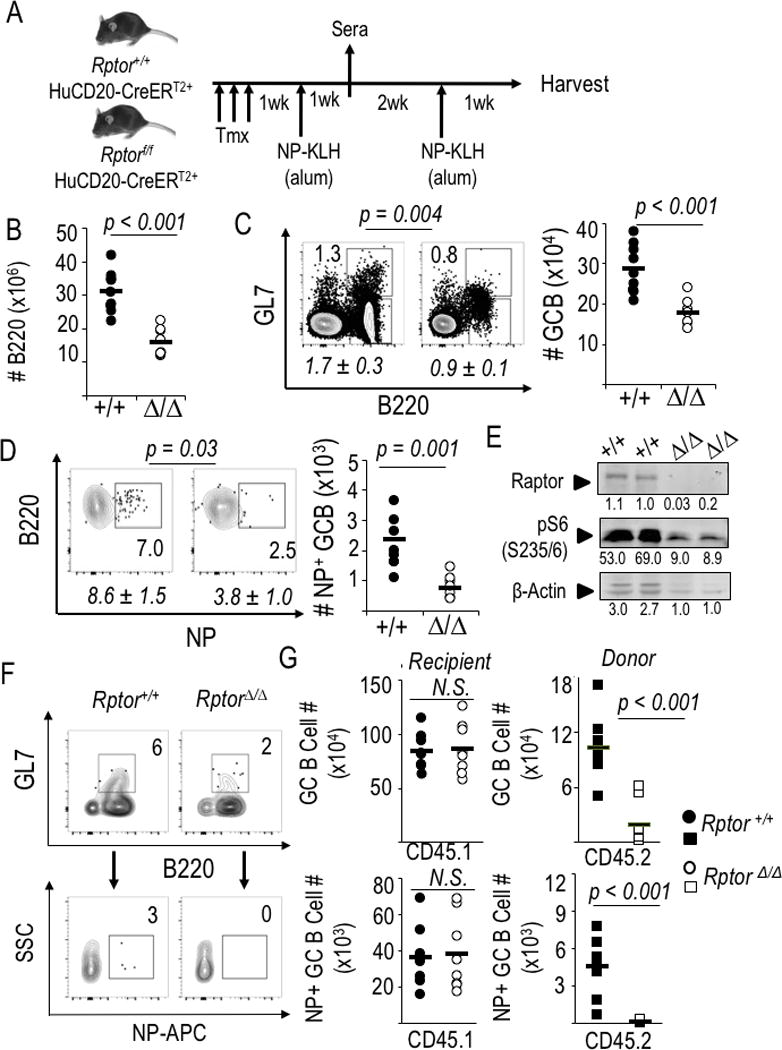
mTORC1 promotes production of class-switched antibodies by B cell-intrinsic mechanisms regulating Ag-specific GC B cells. (A) Schematic of experimental design used for panels B-E. (B-D) Splenocytes harvested 1 wk after the booster immunization were counted and analyzed by flow cytometry. (B) B cell counts in spleens at harvest after immunization and boost of huCD20-CreERT2 mice (Rptor +/+ or Δ/Δ). Each point, calculated from the enumeration of splenocytes and the fraction of B220+ cells [Supplemental Fig. 1A], represents an individual mouse [nine mice of each genotype, distributed evenly across four independent replicate experiments] and the horizontal bars represent means. (C, D) Preferential impact of intrinsic mTORC1 on Ag-specific germinal center B cells. (C) One representative result (with inset numbers representing percentages in the indicated GC-phenotype gate) as well as quantitation of the mean (±SEM) frequencies (italicized) of such B cells in the nine independent mice of each genotype in the four biological replicate experiments as in (B). (D) NP-binding B cells in the gate for viable, IgDneg, myeloid lineageneg cells that were GL7+ (germinal center phenotype), with a representative result from one experiment shown along with mean (±SEM) quantitation as in (C). (E) Recovered cells remained Raptor-depleted. CD19+ B cells were microbead-purified from spleens of tamoxifen-injected, immunized mice (huCD20-CreERT2+ Rptor+/+, and huCD20- CreERT2+ Rptor fl/fl), activated with LPS, cultured (2 d) and then analyzed by immunoblotting to measure Raptor levels and phosphorylation of S6 [anti-pS6(S235/236] as well as actin, shown as fluorescence units quantitated on the Odyssey IR imager. (F, G) Purified WT and Raptor-depleted B cells (as in Figure 1A) were transferred into CD45.1 recipients that were then immunized with NP-KLH, boosted 3 weeks later, and harvested one week after the boost. (F) Representative flow plots from within the viable cell, donor (CD45.2+) gate, with inset numbers representing the percentage germinal center-phenotype (dumpneg GL7+ B220+) B cells from spleens of CD45.1 recipient mice (upper panel pair) and the antigen-specific (NP-APC+) events in the GL7+ population (lower panel pair), which are then quantified in (G) with circles representing recipient mouse B cell phenotyping (CD45.1+) and squares representing the donor (CD45.2+) population (8 mice per donor cell genotype, in balanced distributions among three independent replicate experiments). Representative flow data for donor CD45.2 staining specificity are in Supplemental Fig. 1E.