
Figure 4.
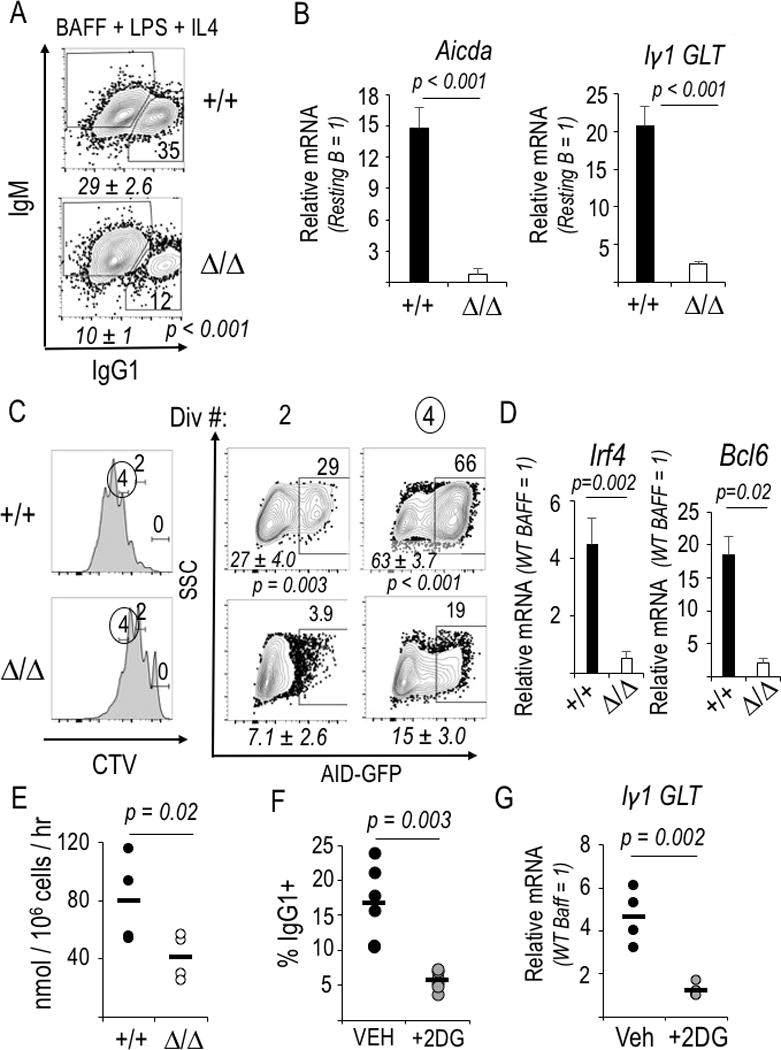
Glycolysis promotes IgCH germ line Iγ1 transcription and CSR. (A) Flow cytometric measurements of Ab class switching to IgG1 after WT and Raptor-depleted B cells were activated (LPS) and cultured with BAFF and IL-4. Shown are the flow plots of samples in one representative experiment. Italicized mean (±SEM) values in the three independent replicates [4 (WT) and 5 (Rptor Δ/Δ) samples] and inset numbers denote the fractions of IgG1+ cells in the viable B220+ gate for the particular experiment. (B) Decreased Aicda and germ line Iγ1 transcripts, measured by qRT2-PCR in mTORC1-deficient and control B cells 2 d after activation and culture as in (A). (n=3 independent replicate experiments). (C) Decreased AID in Raptor-depleted B lymphoblasts. WT and Raptor-deleted B cells encoding a AID-GFP BAC transgene were stained with CellTrace Violet before activation and culture as in (A), followed by flow cytometric analysis. Left panels: A representative division history (dye partitioning); Right: frequencies of GFP+ B cells in the gates for two (2) and four (4) divisions of one representative experiment, with italicized mean (±SEM) values for the samples in four independent replicate experiments. (D) Bcl6 and Irf4 mRNA levels in the samples of (C), measured by qRT2-PCR. (E) Reduced glycolysis in mTORC1-deficient B lymphoblasts. Purified B cells, activated and grown as in Fig. 4A, were assayed for flux of 3H from tritiated glucose into water via glycolytic generation of pyruvate. Mean (±SEM) results from four different samples, distributed equally in two biologically independent experiments. (F) As in Fig. 4A except 2-deoxyglucose (2DG) was added as indicated, with data from six independent experiments graphed as individual values (black or grey circles) along with each mean (horizontal line). (G) Glycolytic flux supports induction of Iγ1 germline transcripts (GLT). Results of qRT2-PCR using RNA of B cells cultured in BAFF alone (resting B cell control) or with IL-4 after LPS activation; each sample was normalized to the BAFF control culture. Shown are individual values from four independent experiments and mean results, displayed as in (F).