
Figure 3. Functional validation of the mutated DAAM1 regulatory element.
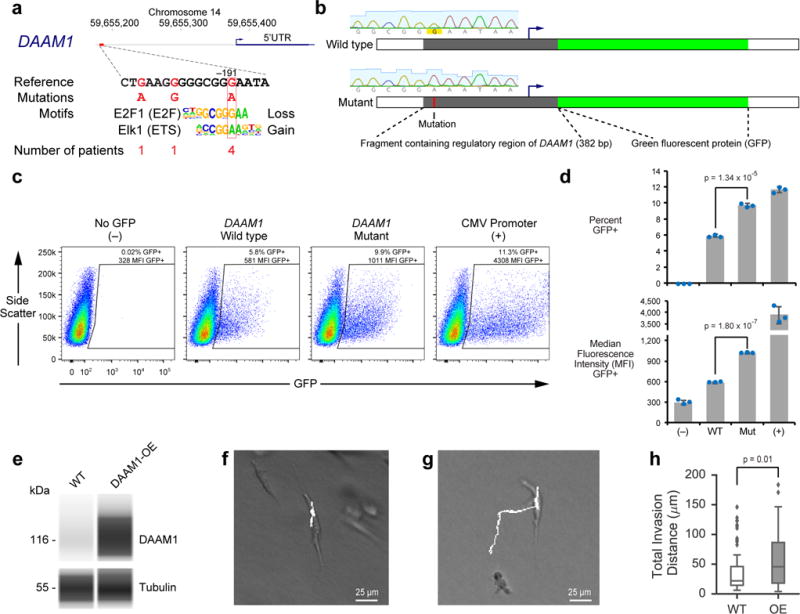
(a) A somatic eQTL in the DAAM1 promoter region is associated with increased mRNA expression levels. (b) Schematic of wild type and mutant GFP reporter constructs along with the Sanger sequencing traces confirming the sequence of the key nucleotide. (c) Flow cytometry analysis of A375 human melanoma cells 48 hours after transient transfection. The polygon delineated by black lines shows the gated region used to define GFP+ cells. (d) Bar graphs (average ± standard deviation across 3 cell culture replicates; p-values from two-tailed t-tests) showing the percentage of GFP+ cells and the median fluorescence intensity of the GFP+ cells. Individual data points are in Supplementary Table 5. (e) Protein electropherogram analysis of wild type and DAAM1 overexpressing MDA-MB-231 cells using the antibodies against DAAM1 and tubulin. The complete electropherogram is in Supplementary Fig. 6e. The image is representative of two independent cell culture experiments. (f, g) Sample trajectories of (f) wild type and (g) DAAM1-overexpressing cells embedded in 2.5 mg/mL 3D collagen hydrogels. (h) Total invasion distance travelled by individual cells (p-value from two-tailed Mann–Whitney U test; 95% confidence intervals of mean are (32.3 μm, 48.2 μm) and (47.6 μm, 67.0 μm) for wild type and DAAM1-overexpressing cells, respectively). Imaging and quantitation was performed on 74 and 83 cells in the wild type and DAAM1-overexpression groups, respectively. Box-plot elements are defined as Fig. 1b.