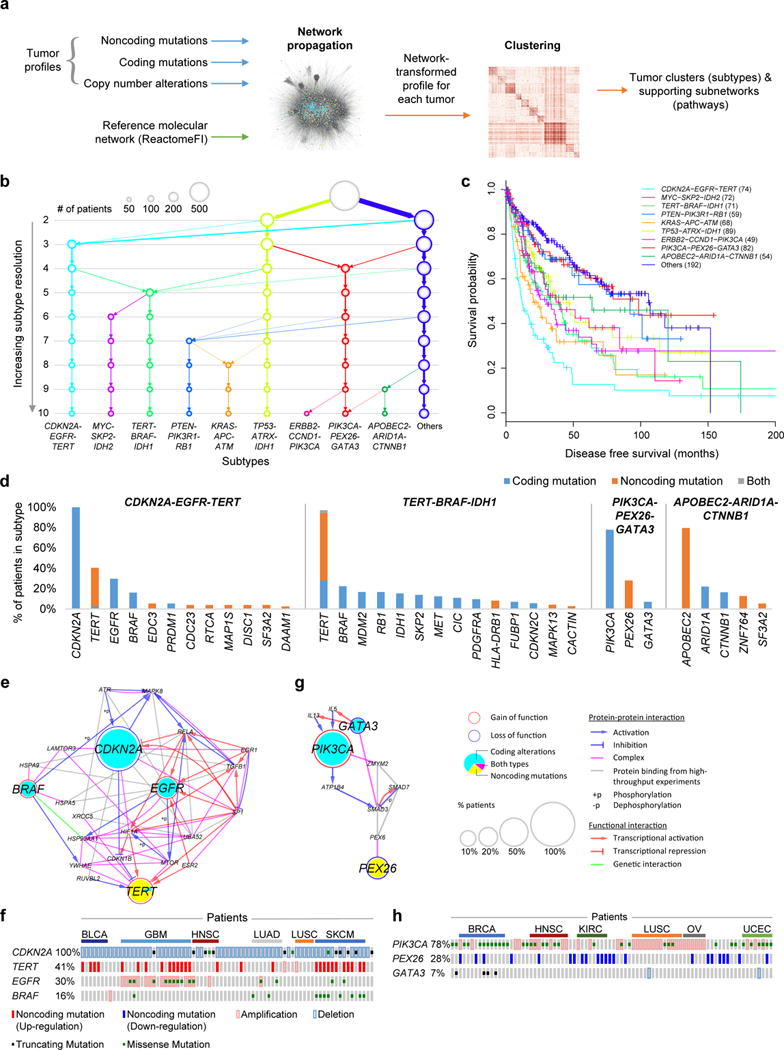
Figure 5. Identification of molecular networks and associated tumor subtypes incorporating noncoding mutations.

(a) Workflow of Network-Based Stratification. (b) Resulting hierarchy of subtypes, at increasing resolution from 2-10 subtypes. (c) Disease-free survival probabilities (y-axis) are plotted against time after diagnosis in months (x-axis) for each of the identified cancer subtypes (colors). Patients with censored survival data are indicated by a “+” at the censoring time (last follow-up). (d) Signature genes are shown for each subtype with a large proportion of patients with noncoding mutations (x-axis), ordered by the percent of patients with alterations (y-axis). (e, g) Pathways characterizing (e) CDKN2A-EGFR-TERT or (g) PIK3CA-PEX26-GATA3 subtypes, defined as subnetwork regions extracted from ReactomeFI by Network-Based Stratification. (f, h) Mutation matrix of the (f) CDKN2A-EGFR-TERT or (h) PIK3CA-PEX26-GATA3 pathway subtypes showing individual tumors (columns, ordered by cancer tissues) with indicated types of mutations on signature genes for that subtype (rows).
