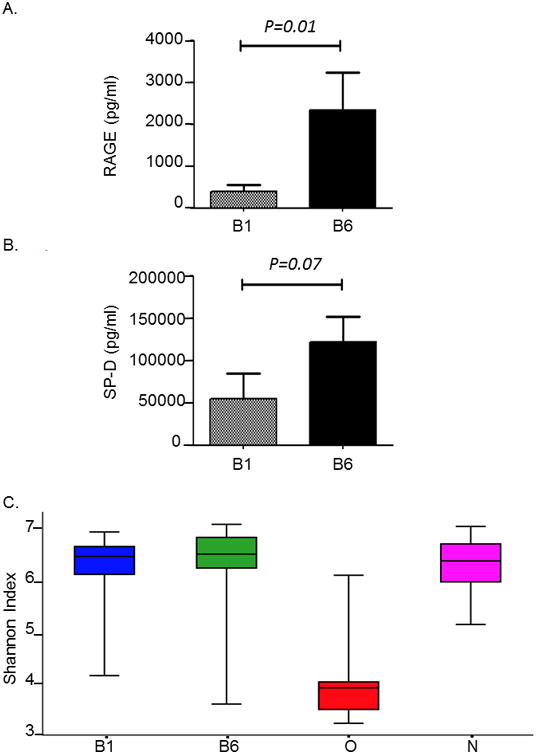
Figure 1. Levels of SP-D, RAGE and alpha diversity of bacterial communities in compartments of the respiratory tract.

A. Bar plot showing the level of RAGE (ng/ml) found in the proximal (B1) and distal airway (B6). Levels of RAGE were significantly higher in the distal as compared to the proximal airway (*P<0.01)
B. Bar plot showing the level of SP-D (ng/ml) found in the proximal (B1) and distal airway (B6). Levels of SP-D were higher in the distal as compared to the proximal airway, but it did not reach statistical significance (P=0.07)
C. Box plots showing alpha diversity of bacterial communities in transplant subjects. Alpha diversity was calculated using Shannon Index for oro-pharyngeal wash (O),nasal (N) and bronchoalveolar lavage samples represented by B1 (proximal airways)and B6 (distal airways). One way ANOVA analysis of B1 versus O, *P<0.01; B6versus O, P<0.01; N versus O; P<0.01.
