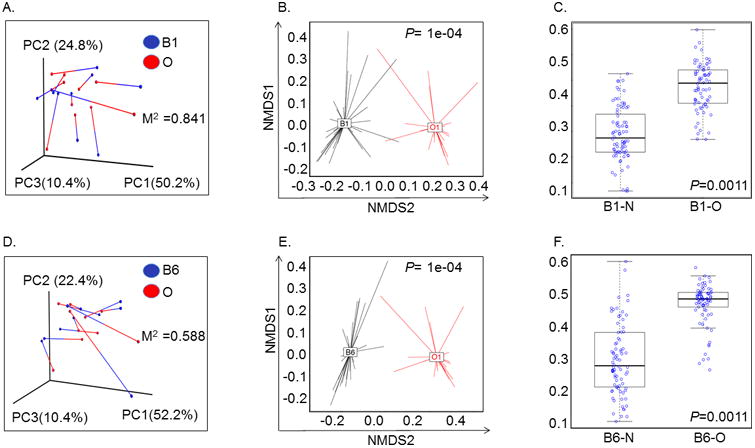
Figure 2. Principal component analysis showing Weighted Unifrac distance between oral and airway microbiome in lung transplant recipients.

A. Relationship between proximal airway (B1) and oropharyngeal (O) bacterial communities within individual subjects. Weighted UniFrac distances were calculated between all pairs of samples within B1 or O, and then each sample type was plotted separately in 3D space by principal coordinate analysis. The two plots (B1 and O) were then transformed by Procrustes analysis to achieve maximum alignment. Each point corresponds to a bacterial community, with B1 communities shown in blue, O communities shown in red, and the two communities from each subject connected by a bar. The red end of each bar connects to the O sample data; the blue end connects to the B1 sample data from the same individual. If B1 and O plots are similar, then the relative distance between connected points (residuals) will be small. The overall similarity is summarized by the M2 value, and statistical goodness of fit is measured by a Monte Carlo label permutation approach (10,000 iterations). The M2 value ranges from 0-1, with 0 suggesting complete overlap (i.e. similarity) and 1 suggesting maximum variation.
B. Principal coordinate analyses (PCoA) plots with centroids showing weighted Unifrac distances between oral and proximal airway microbiomes. The p-values were calculated by Permanova (adonis) test over the weighed Unifrac distance to test the differences between a pair of groups. * P=1e-04
C. Box Plot analysis showing significant difference in Unifrac-weighted distance between proximal airways (B1) – nasal (N) and proximal airways (B1) – oral (O) microbiome. Y-axis represents Unifrac-weighted distance and samples are represented on the X-axis. *P=0.001 (paired t-test).
D. Relationship between distal airway (B6) and oropharyngeal (O) bacterial communities within individual subjects. Weighted UniFrac distances were calculated between all pairs of samples within B6 or O, and then each sample type was plotted separately in 3D space by principal coordinate analysis. The two plots (B6 and O) were then transformed by Procrustes analysis to achieve maximum alignment. Each point corresponds to a bacterial community, with B6 communities shown in blue, O communities shown in red, and the two communities from each subject connected by a bar. The red end of each bar connects to the O sample data; the blue end connects to the B6 sample data from the same individual. If B6 and O plots are similar, then the relative distance between connected points (residuals) will be small. The overall similarity is summarized by the M2 value, and statistical goodness of fit is measured by a Monte Carlo label permutation approach (10,000 iterations). The M2 value ranges from 0-1, with 0 suggesting complete overlap i.e. similarity and 1 suggesting maximum variation.
E. Principal coordinate analyses (PCoA) plots with centroids showing weighted Unifrac distances between oral (O) and distal airway (B6) microbiomes. The p-values were calculated by Permanova (adonis) test over the weighed Unifrac distance to test the differences between a pair of groups. * P=1e-04
F. Box Plot analysis showing significant difference in Unifrac-weighted distance between distal airways (B6) – nasal (N) and distal airways (B6) – oral (O) microbiome. Y-axis represents Unifrac-weighted distance and samples are represented on the X-axis. *P=0.001 (paired t-test).
