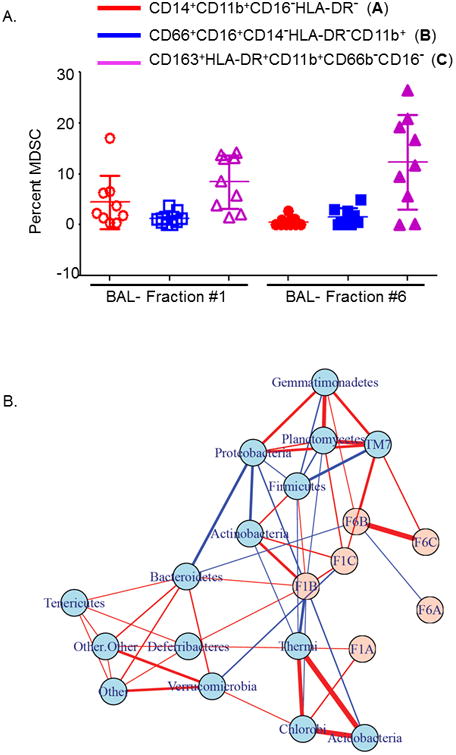
Figure 4. Relative proportions of myeloid-derived suppressor cells in the proximal and distal airways and its correlation with phylum level-OTUs.

A Plot showing different phenotypes of myeloid-derived suppressor cells (MDSCs) in the proximal (B1) and distal airway (B6) bronchoalveolar lavages of lung transplant recipients. Y-axis represents the proportion of MDSCs and X-axis the B1 and B6 fractions. Circles in red represent monocytic MDSCs with a known immunosuppressive function, squares in blue are the neutrophilic MDSCs also with immunosuppressive function and triangles in purple show macrophage like MDSCs with a known pro-inflammatory function. In B1, P<0.05 for comparisons of B versus A & C. In B6, C was significantly higher than A and B (P<0.001). P<0.01 when comparing proportion of subset A in B1 and B6, and P<0.05 when comparing proportion of C in B1 and B6.
B. Correlation networks of bacterial phyla and proportions of the different phenotypic subsets of MDSCs. MDSCs are shown in pink and microbiome measurements of phylum-level OTUs in light blue. Links indicate pairwise Pearson's correlations |r|>0.30. Links with red color indicate a positive correlation while blue indicates a negative correlation. Thickness of the link indicates the strength of the pairwise correlations.
