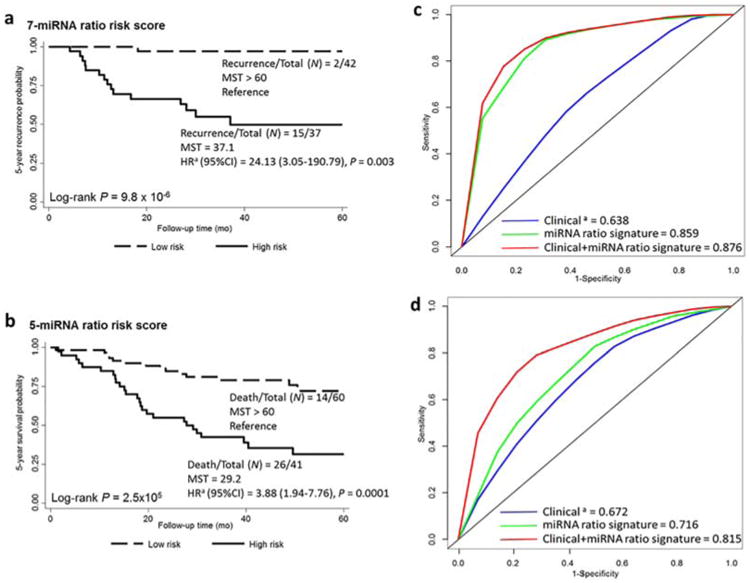
Figure 1.

Kaplan–Meier curves and discriminatory accuracy of the models. Kaplan–Meier curves for the 5-year recurrence (a) and survival (b) rates in 171 patients with early-stage NSCLC in high-risk (solid line) and low-risk (dashed line) groups. The HR for association of the miRNA-ratio risk score with recurrence or death within 5 years was calculated; adjusted for age, sex, smoking history, clinical stage, and treatment modality. N, number of patients with the event (recurrence or death) at 5 years/total number of patients in the dataset. MST, median survival time. (c) Receiver operating characteristic curve showing the discriminatory accuracy of clinical factors, the 7-miRNA ratio signature, and a combination of the 7-miRNA ratio signature and clinical factors for predicting 5-year NSCLC recurrence. (d) Receiver operating characteristic curve showing the discriminatory accuracy of clinical factors, the 5-miRNA ratio signature, and a combination of the 5-miRNA ratio signature clinical factors for predicting death from NSCLC within 5 years. The key shows the areas under the curve for all groups. aIncluding age, sex, smoking history, clinical stage, and treatment modality. [Color figure can be viewed at wileyonlinelibrary.com]
