FIGURE 11.
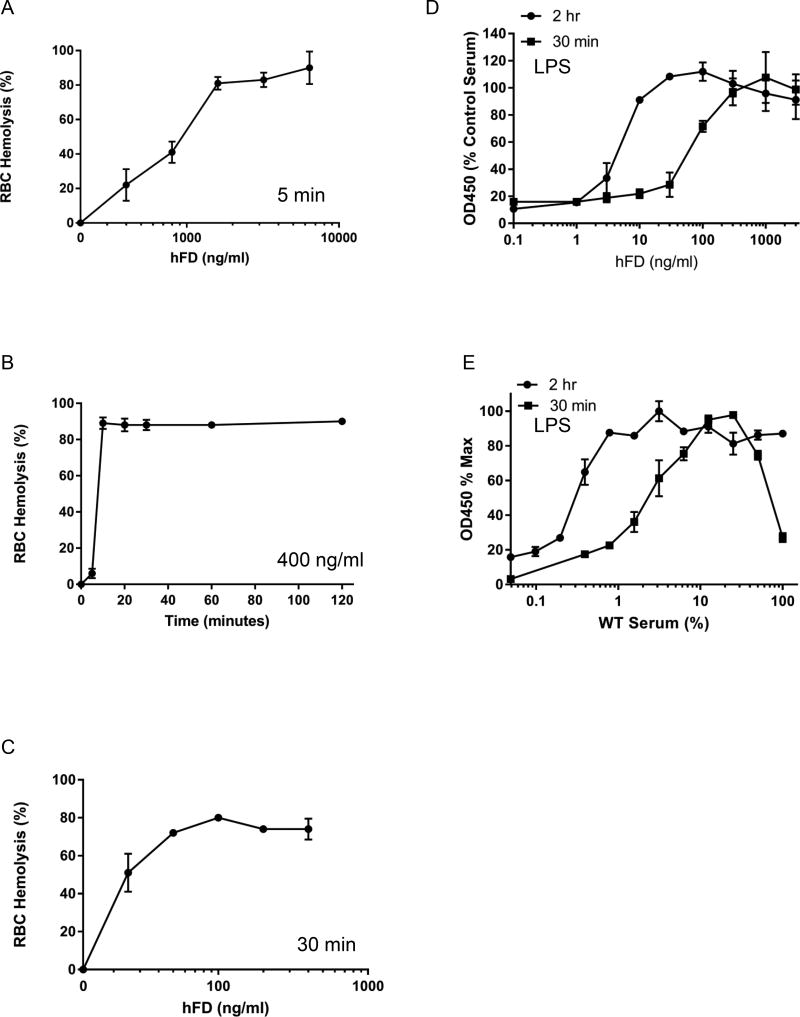
Kinetics and dose response curve for human Factor D in the rabbit RBC hemolysis and LPS microplate assays for AP. A-D were performed in FD-depleted human serum reconstituted with hFD. A) Dose response curve for hFD with a 5 min incubation. B) Kinetics of hemolysis when using 400 ng/ml hFD. C) Dose response curve of hFD when used with a 30 min incubation. RBC hemolysis data are expressed as percent hemolysis. D) Dose response curve for hFD added to FD-depleted human serum in the LPS microplate assay. E) Dose response curve for FD mixing experiment using WT and FD−/− mouse serum in the LPS microplate assay.

