Figure 21.

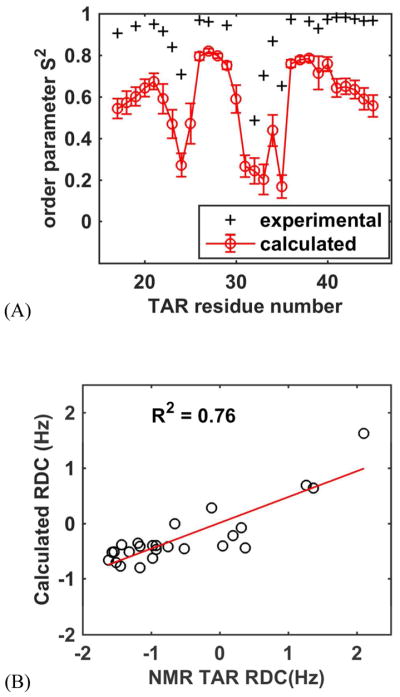
HIV TAR simulation analysis. (A) Comparison of the calculated order parameters S2 with the experimental values. (B) The correlation of calculated average RDC using all of the 8 simulation trajectories with NMR data.

HIV TAR simulation analysis. (A) Comparison of the calculated order parameters S2 with the experimental values. (B) The correlation of calculated average RDC using all of the 8 simulation trajectories with NMR data.