
FIGURE 1.
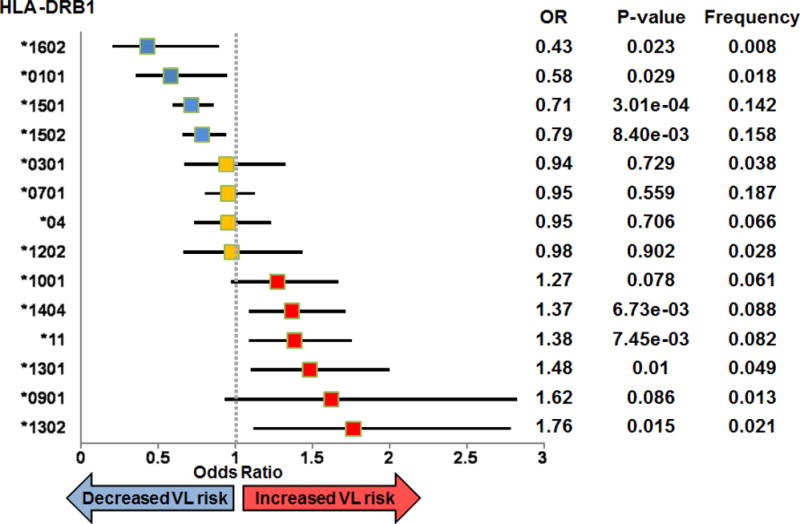
Forest plot showing associations between VL and imputed 2- or 4-digit classical HLA DRB1 alleles. The plot shows odds ratios (OR) and 95% confidence intervals for risk (OR>1; red symbols), neutral (OR~1; yellow symbols), and protective (OR<1; blue symbols) haplotypes. Information to the right of the plot shows values for the OR, the P-value for the association, and the allele frequency.