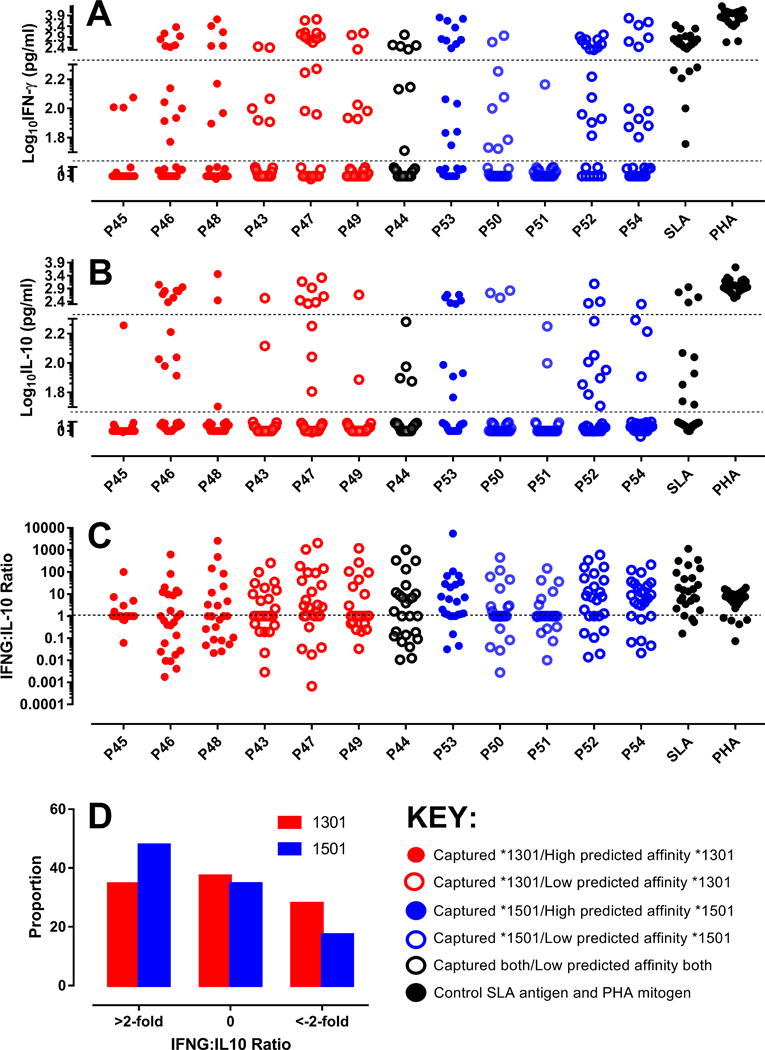
FIGURE 7.

(A) IFN-γ and (B) IL-10 responses in cured patients. The dotted lines represent cut-offs for high-responders (>200 pg/ml), responders (50-200 pg/ml) and non-responders (<50 pg/ml). All values are after subtraction of the NIL antigen control. The y-axes are split to give visual emphasis to the cut-offs for responder status. They are numerically contiguous; all values appear on the graph. TNF responses measured in a subset of these individuals are presented in Figure 5. (C) provides IFN-γ:IL-10 ratios. (D) shows the proportions of individuals with IFN-γ:IL-10 ratios >2-fold, between −2-fold and +2-fold, and <−2-fold. The key indicates which DRB1 allele peptides were captured from, and what their predicted affinity of binding was to that DRB1 allele.
