
Figure 15.
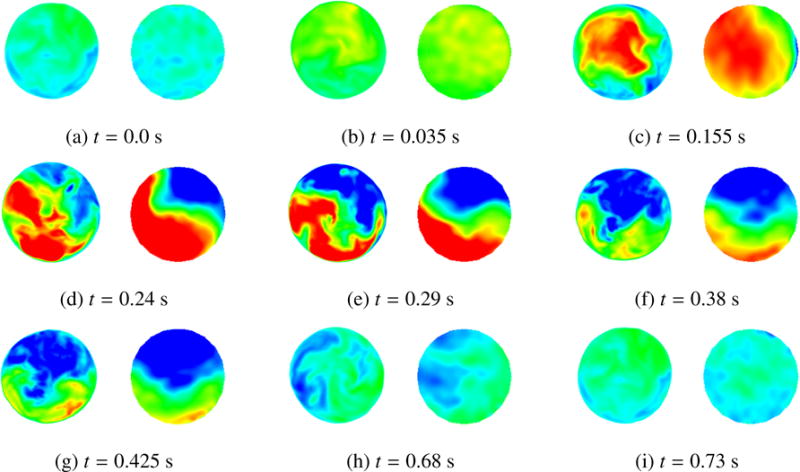
Comparison between FSI results (left) and patient-specific medical image data (right). The time t is synchronized with Figure 10 for the current cycle. Velocity magnitude is plotted using a color scale ranging from −20 cm/s (blue) to 60 cm/s (red). The time instant of the medical image is adjusted to match that of our FSI simulation.