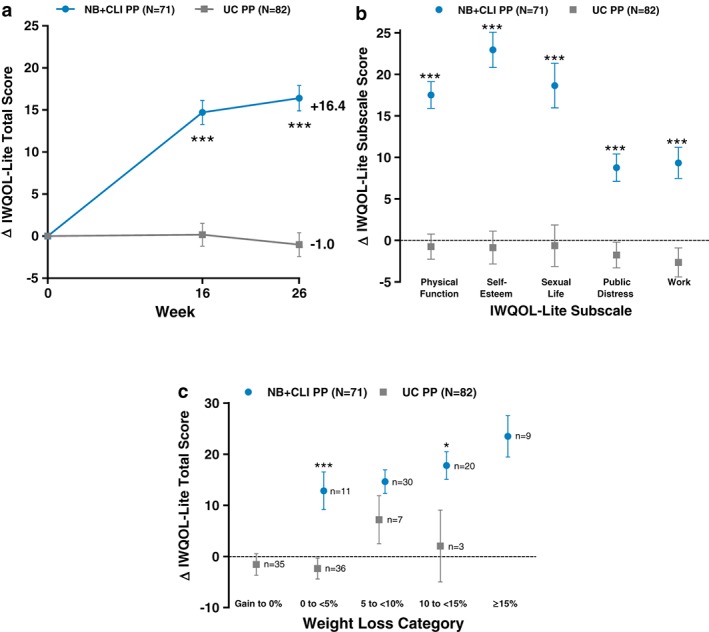
Figure 2.

Change in Impact of Weight on Quality of Life‐Lite (IWQOL‐Lite). (a) Change in total score from baseline at weeks 16 and 26. (b) Change in IWQOL‐Lite subscale scores from baseline to week 26. Change in score was greater in NB + CLI than UC for all subscales. (c) Change in total score from baseline to week 26 by weight loss category. Change in IWQOL‐Lite total score was significantly greater in NB + CLI than UC for weight loss categories of 0 to 5% (P = 0.0004) and 10 to <15% (P = 0.0384). For all panels, points represent least square means and error bars are standard error, *P < 0.05, ***P < 0.001 (NB + CLI vs. UC).
