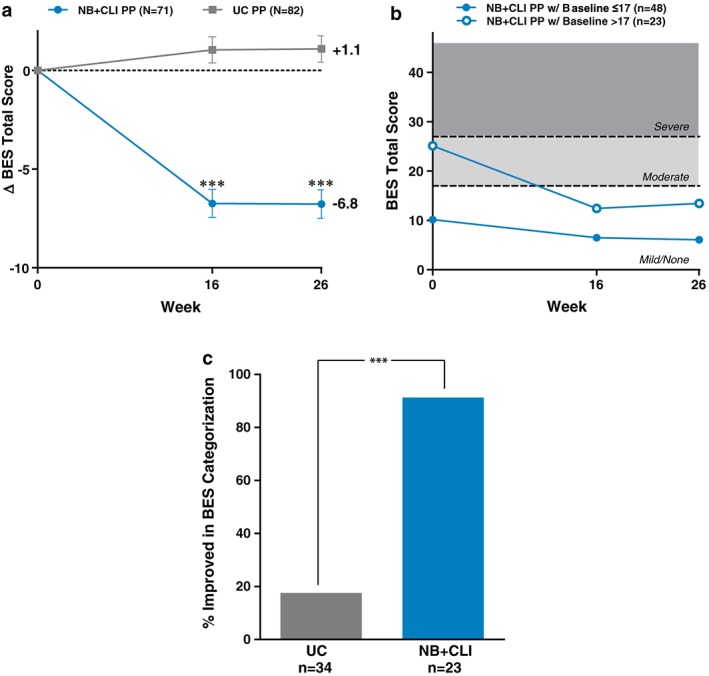
Figure 3.

Binge Eating Scale. (a) Change in total BES from baseline. (b) Total score over time for NB participants with and without significant binge eating problem at baseline (dashed lines provide reference to cut‐off thresholds for binge eating). Total score ≤17 indicates no significant binge eating problem, scores from 18 to 26 indicate moderate binge eating and scores ≥27 indicate severe binge eating. (c) Participants with moderate or severe binge eating at baseline (i.e. BES score >17). Proportion of participants with improvement in Binge Eating Scale categorization from baseline to week 26. A greater proportion of NB + CLI (91.3%) than UC (17.6%) participants improved in BES categorization from baseline to week 26 (P < 0.001). For all panels, points represent least square means and error bars are standard error, ***P < 0.001 when UC is compared with NB + CLI for the same time point.
