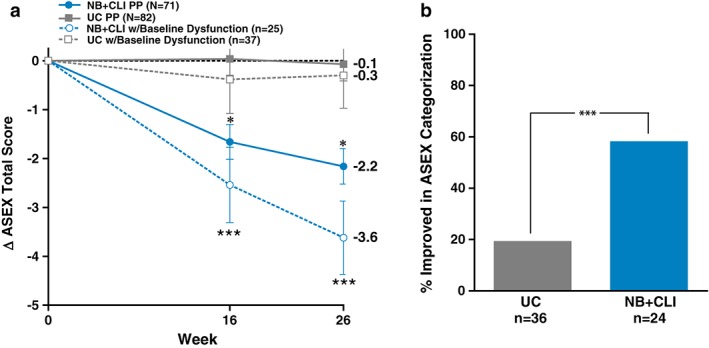
Figure 4.

Arizona Sexual Experiences Scale. (a) Change in total ASEX from baseline. Results are displayed for the entire PP population (groups ‘NB + CLI PP’ and ‘UC PP’) as well as those participants who were classified as having sexual dysfunction at baseline (groups ‘NB + CLI dysfunction’ and ‘UC dysfunction’). (b) Proportion of participants with improvement in ASEX categorization from baseline to week 26 in the population of participants with baseline scores indicative of dysfunction. A greater proportion of NB + CLI (58.3%) than UC (19.4%) participants improved in ASEX categorization from baseline to week 26 (P < 0.002). 2 participants did not have data at week 26 so were excluded. For all panels, points represent least square means and error bars are standard error, *P < 0.05 when UC PP is compared with NB PP for the same timepoint, ***P < 0.001 when UC dysfunction is compared with NB + CLI dysfunction for the same time point.
