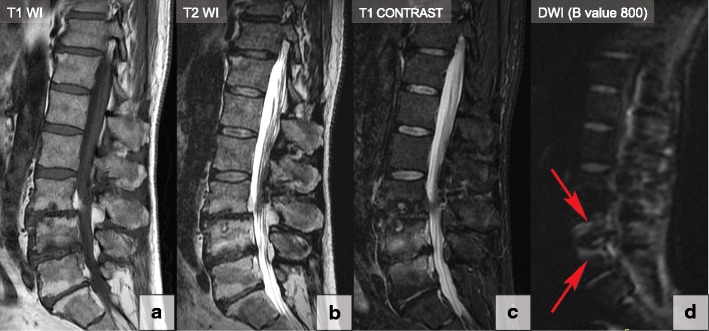
Fig. 18.

The claw sign in type 1 degenerative bone marrow (Modic) changes at L4–L5. T1-WI (a), T2-WI (b), T1-contrast-enhanced (c) and DWI sagittal images (B value 800) (d). The claw sign is identified in the DWI image as linear paired regions of high signal located within adjusted vertebral bodies at the boundaries between the normal and vascularised bone marrow (red arrows). Please note that type 2 degenerative bone marrow changes at L5–S1 and L3–L4 do not demonstrate the claw sign
