
Figure 1.
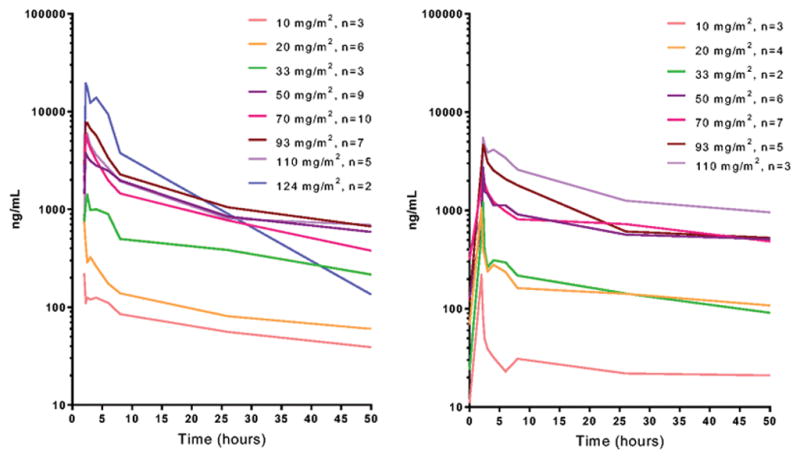
Blood concentration vs time profiles of miR-34a mimic showing mean values (ng/mL) at each dosing level for day 1 (left) and day 18 (right) in cycle 1. Blood samples were collected prior to infusion and at selected times post-infusion.
Official websites use .gov
A
.gov website belongs to an official
government organization in the United States.
Secure .gov websites use HTTPS
A lock (
) or https:// means you've safely
connected to the .gov website. Share sensitive
information only on official, secure websites.
Blood concentration vs time profiles of miR-34a mimic showing mean values (ng/mL) at each dosing level for day 1 (left) and day 18 (right) in cycle 1. Blood samples were collected prior to infusion and at selected times post-infusion.