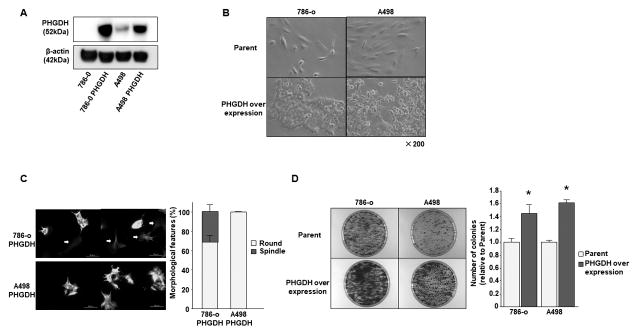
Figure 5. PHGDH over expression in 786-o and A498 parental cells.
A, Immunoblotting analysis showed that PHGDH expression was dramatically elevated in 786-o and A498 cells. B, Representative images of parental and PHGDH overexpressed 786-o or A498 cells. C, Immunofluorescence analysis; PHGDH overexpressed 786-o or A498 cells showed morphological changes from a spindle to a round cell shape. The graph showed the ratio between spindle and round cells in PHGDH overexpressed 786-o or A498 cells. D, Representative image of colony formation in parental and PHGDH overexpressed 786-o or A498 cells. The graph showed the ratio of number of colonies between parental and PHGDH overexpressed cells (*P < 0.05).

