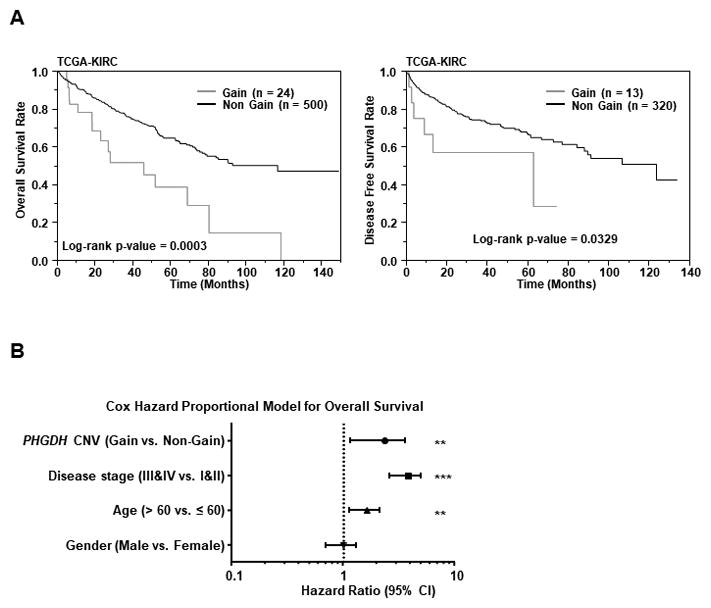
Figure 6. Kaplan-Meier survival plots for PHGDH gene amplification groups in a TCGA cohort.

A, Overall survival (left) and Disease-free survival periods (right) were significantly reduced in the patients with PHGDH gene amplification in comparison to patients without amplification (P =0.0003 and P = 0.0329 respectively). B, Cox proportional analysis for the prediction of overall survival, and summary of the analysis.
