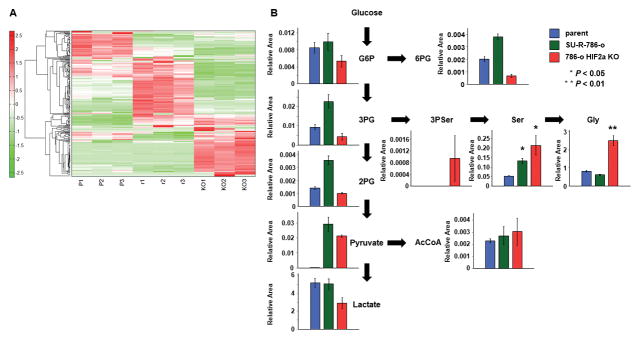
Figure 7. Serine biosynthesis pathway was up-regulates in HIF2α-KO-SU-R-786-o cells.
A, Heat map diagram of metabolites among 786-o parent cells, SU-R-786-o cells, and HIF2α-KO-SU-R-786-o cells. Precise information of all metabolites are listed in Supplementary Table 2. B, Intracellular concentration of key metabolites involved in glycolysis and serine biosynthesis pathway. Representative metabolites such as glucose 6-phosphate (G6P), 3-phosphoglycerate (3PG), 2-phosphoglycerate (2PG), pyruvate, lactate, 6-phosphogluconate (6PG), 3-Phosphoserine (3P Ser), Serine (Ser), Glycine (Gly), and Acetyl-CoA (AcCoA) are shown here. Others are listed in Supplementary Table 2.

