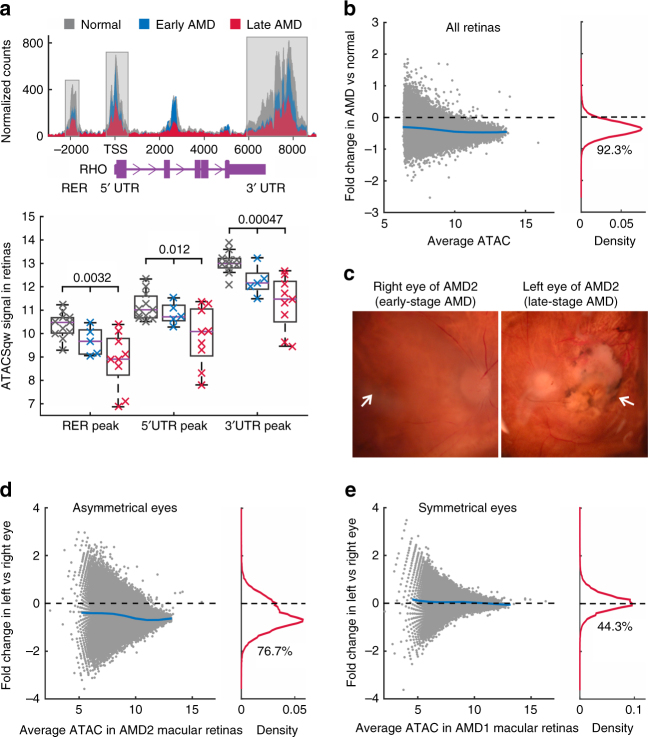
Fig. 2.
Changes of chromatin accessibility in AMD retinas. a The chromatin accessibility in regulatory regions of the rhodopsin gene RHO. Top panel shows average ATAC-Seq signal for each category. Bottom panel is the boxplot of log2-transformed ATAC-Seq signal for all samples (n = 11 for normal, 5 for early AMD, and 9 late AMD). One-way ANOVA test was performed. TSS, transcript start site. RER, rhodopsin enhancer region. UTR, untranslated region. b Changes of chromatin accessibility in AMD (n = 14) relative to normal (n = 11) in all retina samples. Each dot represents one ATAC-Seq peak. Blue line in the left panel indicates average fold changes of peaks with the same ATAC-Seq intensity. The percentage of reduced peaks is shown under the density curve in the right panel. c The microscopy of right and left eyes from one AMD patient with asymmetrical disease status. The left image shows early AMD (mild RPE pigmentary changes) while the right image shows geographic atrophy. Arrows indicate the macular regions. Note that human macula has a diameter of around 6 mm. d ATAC-Seq signal changes in right and left macular retinas from the AMD patient with asymmetrical disease status. e Accessibility changes in one AMD patient whose eyes are at the same (symmetrical) disease stage

