Fig. 1.
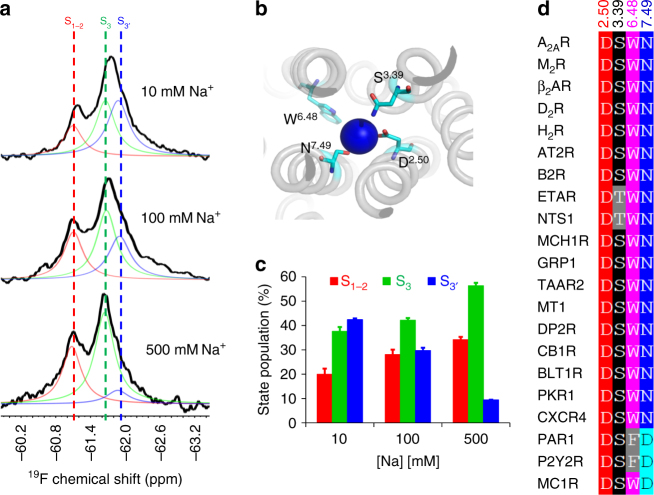
Allosteric modulation of A2AR by the monovalent cation Na+. a 19F NMR spectra of 200 μM BTFMA-labeled A2AR-V229C as a function of Na+ concentration (10 mM, 100 mM and 500 mM NaCl). Three distinct resonances correspond to inactive (S1−2, shown in red) and active states (S3 and S3′, shown in green and blue, respectively). b Top view showing conserved residues (D2.50, S3.39, W6.48 and N7.49) associated with the sodium pocket of A2AR. c Population histogram of states, S1−2, S3 and S3′, corresponding to spectra shown in (a). d Alignment of conserved residues associated with the sodium pocket in class A GPCRs. Error bars are defined based on the difference between the fitted area associated with the deconvolved spectrum and the area associated with the experimental spectrum. This error bar definition was applied into all spectra without specific description

