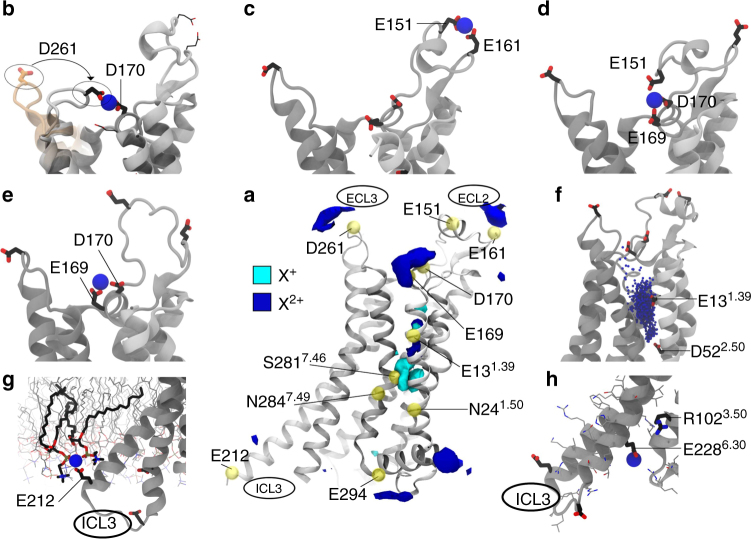
Fig. 5.
Atomistic MD simulations of divalent cation binding by A2AR. a Spatial distribution of cations around A2AR. Surfaces enclose cation density 3 kBT above homogeneous populations for monovalent (cyan) and divalent (blue) cations in simulations of three agonist-bound A2AR crystal structures [PDB IDs: 2YDO, 3QAK and 5G53]. b–e Divalent cation bridges observed in the receptor’s extracellular domain. Orange ECL3 in part (b) shows the initial conformation and highlights the reorganization of D261 during MD simulation. f Divalent cation binding close to the sodium pocket, coordinated by acidic residues E131.39 or D522.50. g Divalent cation bridging between E212 and a phosphoryl group in the lipid bilayer. h Divalent cation binding to E2286.30 (ionic lock: DR1023.50Y—E2286.30) (see also Fig. 7)

