Fig. 1.
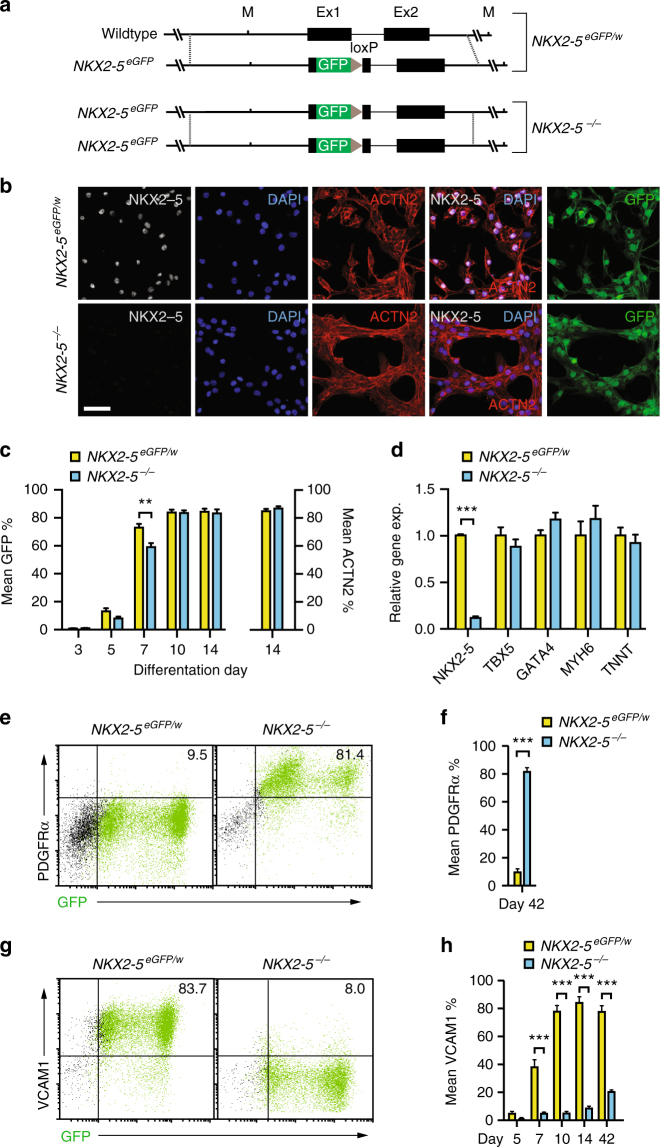
NKX2-5 regulates cardiomyocyte differentiation. a Schematic representation of NKX2-5eGFP/w and NKX2-5−/− (NKX2-5 null) genotype. b Immunofluorescent detection of NKX2-5, ACTN2 and GFP in NKX2-5eGFP/w and NKX2-5−/− cultures at day 14 of cardiac differentiation. Nuclei counterstained with DAPI. Scale bar = 50 μM. c Bar graph quantifying GFP and ACTN2 expression in differentiating NKX2-5eGFP/w and NKX2-5−/− cultures, as determined by flow cytometry (see Supplementary Fig. 1). Data represent mean ± SEM (n = 5). **p < 0.01 (Student’s t-test). d Q-PCR analysis of NKX2-5eGFP/w and NKX2-5−/− cultures at day 14 of differentiation. NKX2-5 null cardiomyocytes show normal expression of characteristic cardiomyocyte markers. Data represent mean ± SEM (n = 4). *** p < 0.001 (Student’s t-test). e, f Representative flow cytometry plots (e) and bar graph (f) of PDGFRα expression in NKX2-5eGFP/w and NKX2-5−/− cultures at day 42 of differentiation. Numbers on plots are percentage of cells in quadrant. Data represent mean ± SEM (n = 4). ***p < 0.001 (Student’s t-test). g, h Representative flow cytometry plot at day 14 of differentiation (g) and bar graph (h) of a time course of VCAM1 expression in differentiating NKX2-5eGFP/w and NKX2-5−/− cultures. Numbers on plots are percentage of cells in quadrant. Data represent mean ± SEM (n = 4). ***p < 0.001 (Student’s t-test)

