Fig. 3.
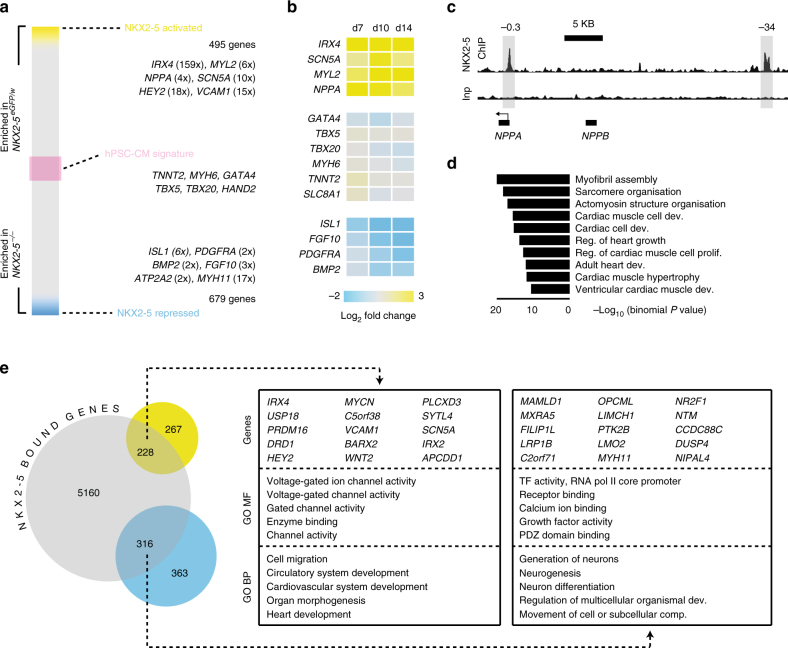
Defining the NKX2-5 transcriptional network. a Schematic heat map showing differential gene expression between GFP+ cells isolated from NKX2-5eGFP/w and NKX2-5−/− GFP+ cultures at day 10 of cardiac differentiation. In NKX2-5 null GFP+ cells, NKX2-5 activated genes (yellow) have reduced expression whereas NKX2-5 repressed genes (blue) have increased expression. Expression of hPSC-CM signature genes (pink) is largely NKX2-5 independent. Numbers represent mean fold change in gene expression (n = 3). b Heat map of gene expression in GFP+ cells isolated from NKX2-5eGFP/w and NKX2-5−/− cultures at day 7, 10, or 14 of cardiac differentiation, as determined by Q-PCR. Displayed as mean log2 fold change between the two genotypes at each time point (n = 4). c Representative NKX2-5 ChIP-seq data showing localization of NKX2-5 binding at the NPPA locus. Highlighted peaks in NKX2-5 ChIP-seq track denote conserved NKX2-5 binding regions at −0.3 kb and −34 kb from transcriptional start site enriched after chromatin immunoprecipitation with NKX2-5. Inp = input chromatin. d Most represented GO biological process terms returned when the closest genes to NKX2-5 binding sites were analyzed. This data shows NKX2-5 binds near genes involved in heart development and cardiomyocyte function. e Venn diagram outlining overlap between genes positively (yellow) and negatively (blue) regulated by NKX2-5, and NKX2-5 bound genomic regions (gray). Boxes contain top 15 differentially regulated genes with proximal NKX2-5 binding sites and top 5 GO terms (MF = molecular function, BP = biological process) from the genes within the overlapping regions of the Venn diagram

