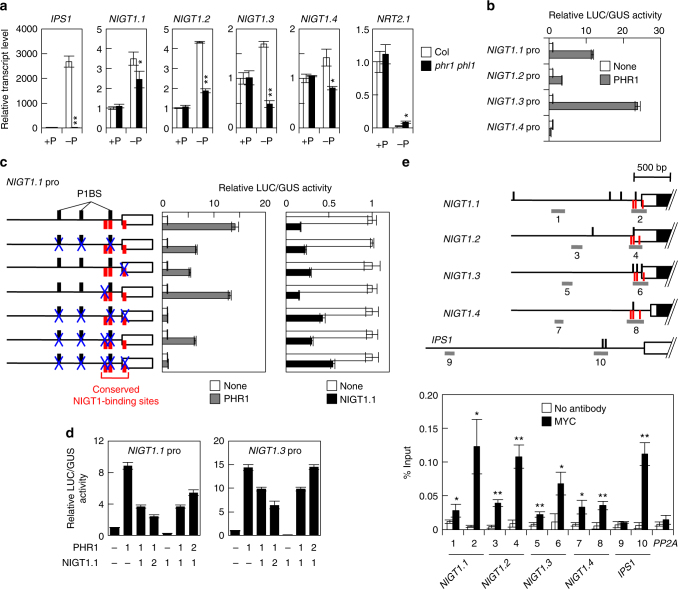
Fig. 7.
PHR1-dependent activation of NIGT1-clade genes. a Effects of P starvation on the expression of NIGT1-clade genes and NRT2.1 in roots of Arabidopsis Col and phr1 phl1 double mutant. Roots of Arabidopsis plants that were grown hydroponically under P-sufficient (+P) or P-starved (−P) conditions for 5 days were used for RT-qPCR analysis. IPS1 is a positive control for P starvation. Values are normalised with expression levels of PEX4, and means of biological triplicates with s.d. are shown. *p < 0.05, **p < 0.01 by two-tailed t-test compared with corresponding Col values. b Transactivation of NIGT1 promoters by PHR1. A reporter plasmid containing 1 kb promoter fragments of NIGT1-clade genes fused to the LUC gene was co-transfected into protoplasts with the PHR1 expression vector or an empty vector (none) and the UBQ10-GUS plasmid. c Identification of sites mediating PHR1 regulation and autoregulation in the NIGT1.1 promoter. Transactivation of wild-type and mutated NIGT1.1 promoters by PHR1 and repression by NIGT1.1 were analysed by co-transfection assays. The horizontal line indicates the 1 kb NIGT1.1 promoter. Vertical black and red lines indicate the P1BS sequences and the conserved NIGT1 sites, respectively. Mutated sites are indicated with blue X. d Competitive regulation of the NIGT1-clade gene promoters by PHR1 and NIGT1. Expression vectors for PHR1 and NIGT1.1 were co-transfected into protoplasts at different ratios, together with the LUC reporter gene under the control of the NIGT1.1 or NIGT1.3 promoter. In b−d, relative LUC activity is given as mean ± s.d. of three biological replicates. e Binding of PHR1 to the NIGT1-clade gene promoters in vivo. Two different regions from each NIGT1-clade gene promoter were amplified in a ChIP assay of transgenic plants expressing MYC-tagged PHR1 cultured under the P-starved condition. The IPS1 promoter is a known target of PHR1 and is used as a positive control, and PP2A is a negative control. Data are means of three biological samples and shown with s.d. *p < 0.05, **p < 0.01 by one-tailed paired t-test compared with corresponding control (no antibody) values

