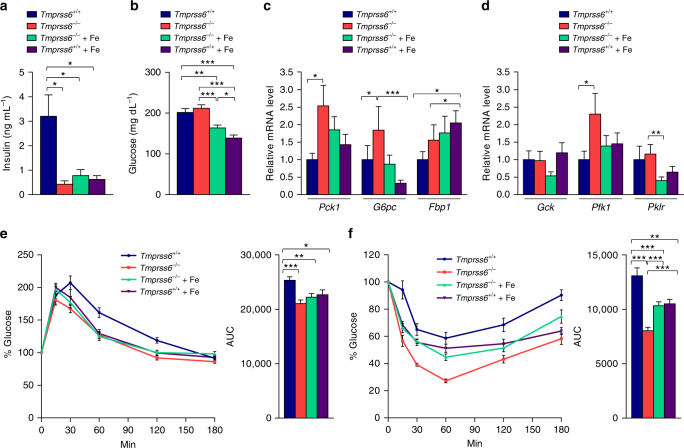
Fig. 4.
Improved glucose metabolism in HFD-fed Tmprss6-deficient mice. a Fasting plasma concentration of insulin in HFD-fed Tmprss6+/+ (n = 10), Tmprss6−/−(n = 6), and both iron-treated Tmprss6−/− and Tmprss6+/+ mice (n = 8 and n = 6 respectively). b Fasting blood glucose concentration in HFD-fed Tmprss6+/+ (n = 11), Tmprss6−/− (n = 13), and both iron-treated Tmprss6−/−and Tmprss6+/+ mice (n = 13 and n = 10 respectively). Relative expression levels of genes related to gluconeogenesis (c) and glycolysis (d) in liver samples from HFD-fed Tmprss6+/+ (n = 11), Tmprss6−/− (n = 8–9), and both iron-treated Tmprss6−/−and Tmprss6+/+ mice (n = 10-11 and n = 8 respectively). e Glucose tolerance test after overnight fasting in HFD-fed Tmprss6+/+ (n = 11), Tmprss6−/− (n = 12), and both iron-treated Tmprss6−/−and Tmprss6+/+ mice (n = 9 and n = 9 respectively). f Insulin tolerance test after overnight fasting in HFD-fed Tmprss6+/+ (n = 11), Tmprss6−/− (n = 12), and both iron-treated Tmprss6−/−and Tmprss6+/+ mice (n = 13 and n = 11 respectively). AUC, area under the curve. Data shown are mean ± SEM. *P < 0.05, **P < 0.01, ***P < 0.001, two-tailed Student’s t test and Mann–Whitney test

