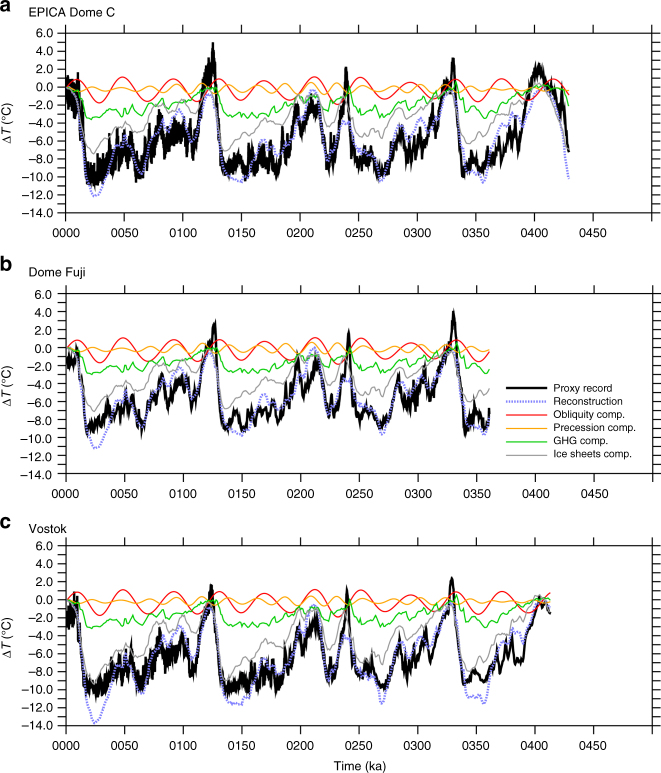
Fig. 2.
Temperature signals in ice cores and annual mean linear reconstructions. Temperatures over the past several glacial cycles from ice cores (black) and GFDL CM2.1 annual mean model-based linear reconstructions (dashed blue) for a EPICA Dome C, b Dome Fuji, and c Vostok. The model-based linear reconstruction is the sum of contributions from obliquity (red), precession (orange), greenhouse gases (green), and ice sheets (gray). Reconstruction ΔT is plotted relative to 1 ka and the proxy records are plotted with the same mean value as the reconstruction

