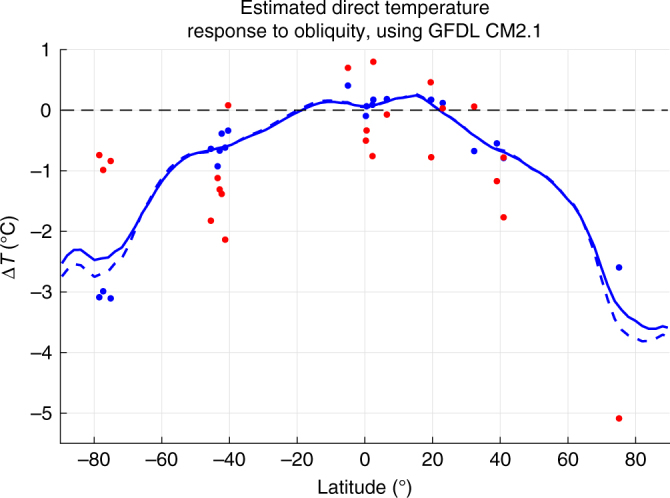
Fig. 3.

Obliquity temperature response in GFDL CM2.1 and estimated from proxies. Temperature changes at specific proxy locations in the GFDL CM2.1 low–high obliquity experiment (blue dots) and the apparent direct short-term obliquity response in proxies (red dots), which were derived by scaling the modeled obliquity response in the linear reconstructions to match the proxies. To show how the modeled temperature anomalies at proxy locations compare to zonal-mean values, lines show the zonal-mean anomalies for both surface air temperature (solid) and surface temperature (dashed) in GFDL CM2.1
