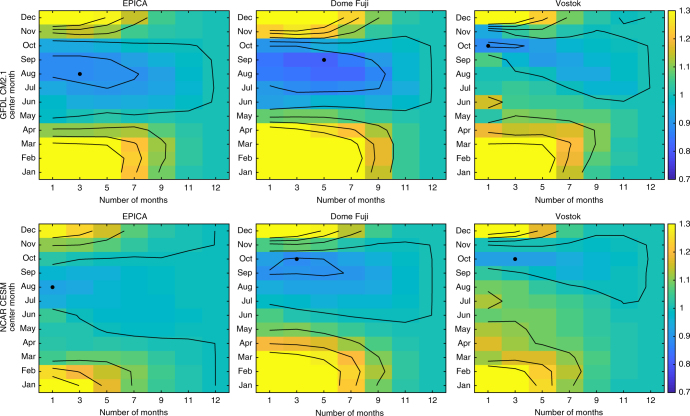
Fig. 4.
Mismatch between ice cores and linear reconstructions using different monthly averages. Relative mismatch between proxy temperature records and linear reconstructions using different monthly averages. Each grid box corresponds to the mismatch for a linear reconstruction averaged over a portion of the year. The y-axis defines the central month of the mean and the x-axis defines the number of months included in the mean. The rightmost column (labeled 12) indicates a 12-month mean. Values are the root mean square error (RMSE) of each monthly mean case normalized by the RMSE of the annual mean case, so monthly mean reconstructions which better match the proxy record compared to the annual mean case have values <1. Contours are drawn from 0.7 to 1.3 with a contour interval of 0.1. The black dot indicates the lowest RMSE. As an example of how to interpret this figure, the lowest RMSE in the top center panel corresponds to a 5-month average centered on September—in other words July to November. The calculation is done for all three Antarctic locations (EPICA Dome C, Dome Fuji, and Vostok) for (top) CM2.1 and (bottom) CESM

