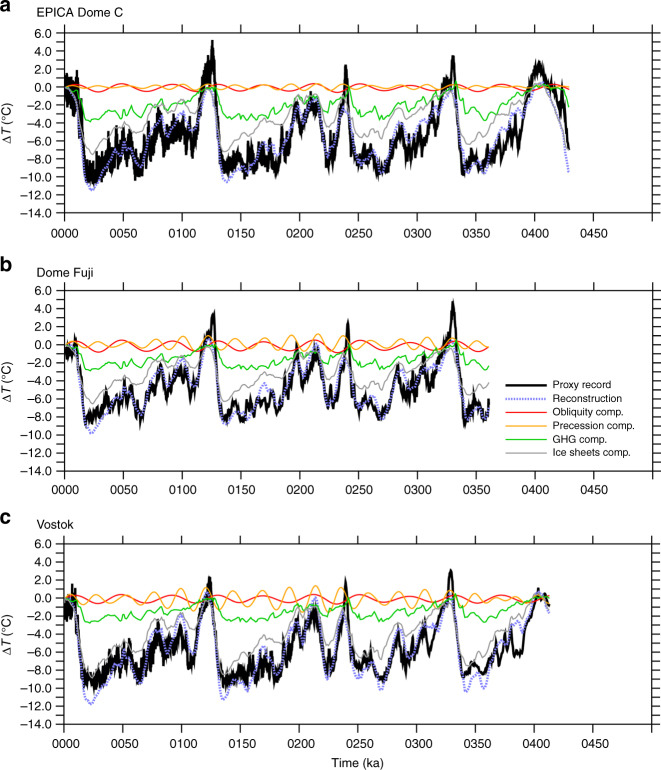
Fig. 5.
Temperature signals in ice cores and seasonally-averaged linear reconstructions. Like Fig. 2, but using the best fit seasonal weighting for the GFDL CM2.1 linear reconstruction (black dots in upper row of Fig. 4). Temperatures over the past several glacial cycles from ice cores (black) and GFDL CM2.1 seasonally-averaged model-based linear reconstructions (dashed blue) for a EPICA Dome C, b Dome Fuji, and c Vostok. The model-based linear reconstructions are the sum of seasonally weighted contributions from obliquity (red), precession (orange), greenhouse gases (green), and ice sheets (gray). The weighting is a July–September for EPICA Dome C, b July–November for Dome Fuji, and c October for Vostok, although other seasonal means also improve the fit compared to the annual mean case (Fig. 4). The seasonally weighted reconstructions shown here generally match the obliquity and precession-scale variability in the proxy records better than the annual mean reconstructions shown in Fig. 2

