Fig. 1.
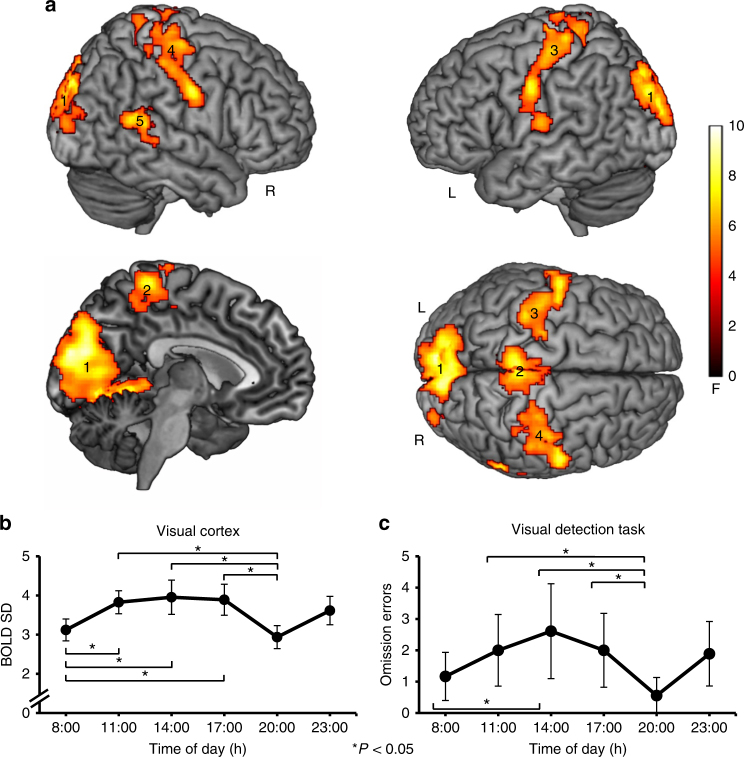
Resting-state BOLD SD is reduced in sensory cortices at twilight, when visual detection is improved. a Significant main effect of ToD for resting-state BOLD SD in visual (cluster 1, peak MNI value −8 −90 20), somatosensory (clusters 2–4, peak MNI values −4 −38 68; −60 −8 40; 58 −8 36), and right auditory cortices (cluster 5, peak MNI value 64–48 20) (cluster-extent based threshold: k = 395, P < 0.05, family-wise error (FWE) corrected; cluster-defining primary threshold of F(5, 65) > 4.70, P < 0.001, uncorrected; n = 14). Color indicates F-values. For further statistical details see Table 1. b Group analysis showing significant resting-state BOLD SD decreases in visual cortex (cluster 1) at 08:00 and 20:00 h compared to midday measurements (graph shows the group-mean BOLD SD values and error bars represent the 95% confidence interval. Asterisks mark significant pairwise differences at P < 0.05, Bonferroni corrected). Note that somatosensory, and right auditory cortex show similar ToD-effects (Supplementary Fig. 1c). For further statistical details see Table 2. c Main effect of ToD for omission errors during the visual detection task. Participants committed significantly less omission errors at the same times, when resting-state BOLD SD was decreased (see b; graph shows the group-mean omission errors and error bars represent the 95% confidence interval. Asterisks mark significant pairwise differences at P < 0.05)

